. 2025 Oct 3;16(1):8834.
doi: 10.1038/s41467-025-63867-4.

All-optical voltage interrogation for probing synaptic plasticity in vivo

Affiliations

All-optical voltage interrogation for probing synaptic plasticity in vivo

Jacques Carolan et al. Nat Commun. .

Abstract

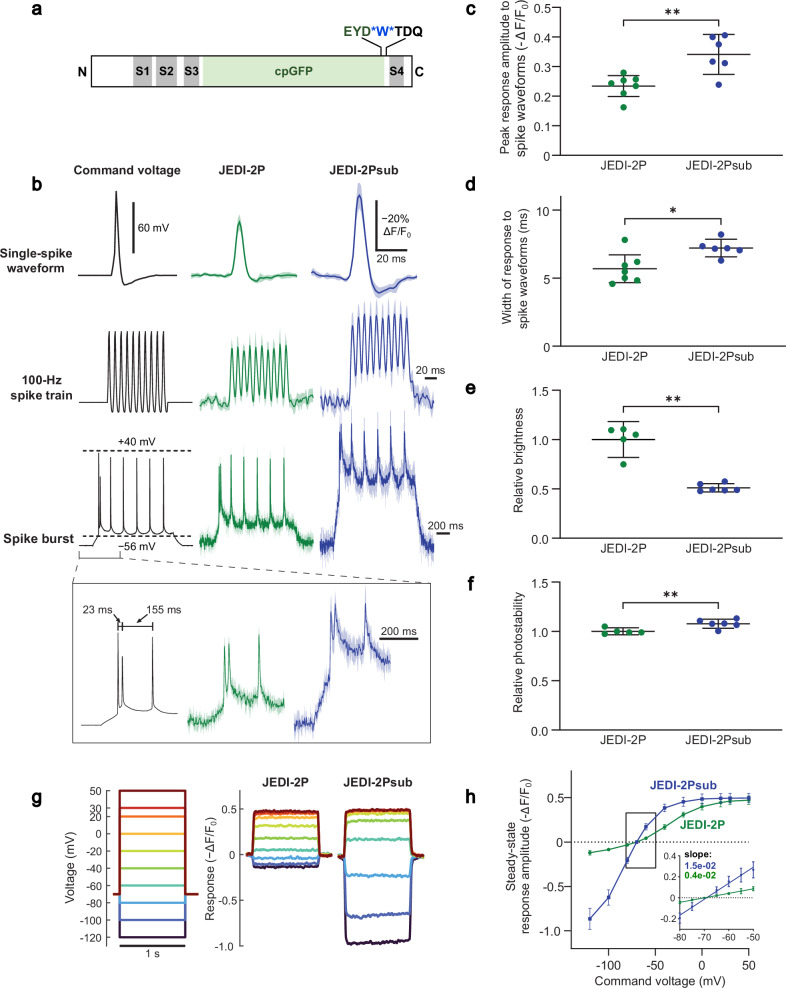
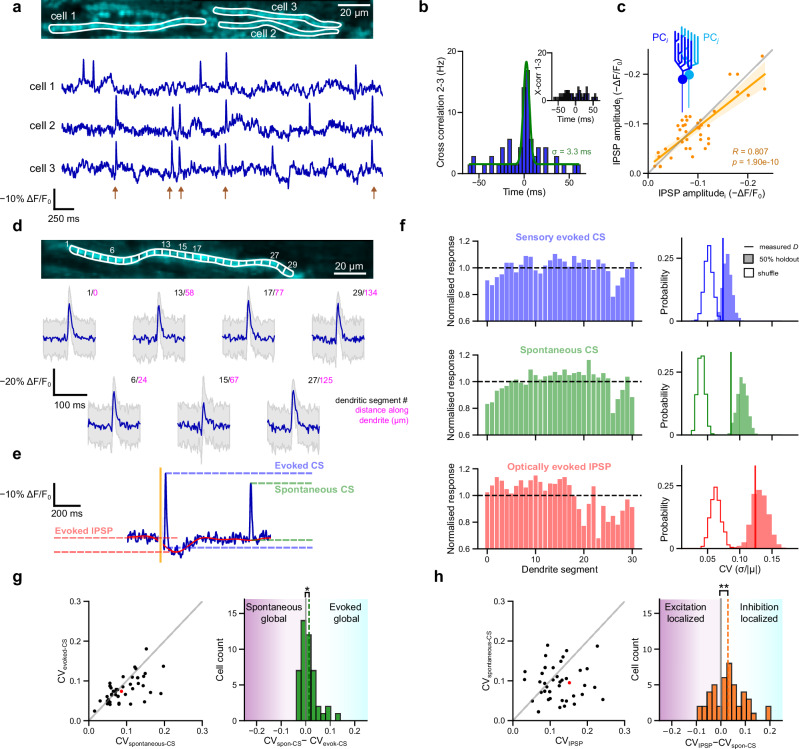
Measuring synaptic efficacy and defining the rules for induction of synaptic plasticity at identified connections in the mammalian brain is essential for understanding how synapses contribute to learning and memory. This requires new approaches to selectively evoke presynaptic activity and measure postsynaptic responses with high spatiotemporal resolution and high sensitivity over long periods in vivo. Here we develop an all-optical approach to probe synaptic plasticity at identified cerebellar synapses in awake, behaving mice. We developed and applied JEDI-2Psub, a genetically encoded voltage indicator with increased sensitivity around resting membrane potentials, to record subthreshold and suprathreshold activity in Purkinje cell (PC) dendrites while selectively activating their granule cell (GrC) inputs using optogenetics and their climbing fiber (CF) inputs using sensory stimulation. We measured synaptic potentials and complex spike signals across the dendrites of multiple neighboring PCs, enabling us to examine correlations in voltage signals within and between neurons. We show how pairing GrC activity with sensory-evoked CF inputs can trigger long-term plasticity of inhibitory responses in PCs. These results provide a blueprint for defining the rules for plasticity induction at identified synapses in awake animals during behavior.


Conflict of interest statement

Competing interests: F.S.-P. holds a US patent for a voltage sensor design (patent #US9606100 B2) that encompasses the GEVI reported here. The other authors declare no competing interests.

Figures

Fig. 1
Fig. 1. JEDI-2Psub displays larger fluorescence responses to subthreshold voltage dynamics than JEDI-2P under laser-scanning two-photon excitation.
a An insertion of a tryptophan (blue) immediately after the circularly permuted GFP (cpGFP, green) in JEDI-2P created the modified sensor JEDI-2Psub. In this linear representation, gray bars represent the four transmembrane helices (S1-S4) of the voltage-sensing domain. b Mean fluorescence response to a single spike waveform of 2 ms full width at half maximum (top), a 100 Hz spike train (middle), and spike train on top of a subthreshold depolarization (bottom) (n = 7 JEDI-2P and n = 6 JEDI-2Psub HEK293A cells). c Quantification of the peak response of JEDI-2P (n = 7 cells) and JEDI-2Psub (n = 6 cells) to single spike waveforms (two-sided t-test p = 3.40 × 10³). d Quantification of the width of the response of JEDI-2P (n = 7 cells) and JEDI-2Psub (n = 6 cells) to single spike waveforms (two-sided t-test p = 1.23 × 10⁻²). e Brightness comparison. Values are normalized to JEDI-2P (n = 5 JEDI-2P and n = 6 JEDI-2Psub wells, two-sided Mann–Whitney U-test p = 4.30 × 10²). f Photostability comparison. Values are normalized to JEDI-2P (n = 5 JEDI-2P and n = 6 JEDI-2Psub wells, two-sided t-test p = 8.30 × 10²). g Mean fluorescence response to voltage steps from a resting membrane potential of −70 mV (n = 7 JEDI-2P and n = 6 JEDI-2Psub HEK293A cells). h Quantification of (g). Inset, response to subthreshold voltages. The inset displays the linear regression for each GEVI (JEDI-2P has a slope = 0.43 and R2 = 0.91, JEDI-2Psub has a slope = 1.5 and R2 = 0.92). Data are presented as mean values with 95% confidence interval. For all figures, *p < 0.05; **p < 0.01; ***p < 0.001.
Fig. 2
Fig. 2. In vivo two-photon voltage imaging and optogenetics reveal subthreshold dynamics in Purkinje cell (PC) dendrites.
a Two-photon voltage imaging and optogenetic stimulation setup. b Cerebellar microcircuit. c Co-expression of the genetically encoded voltage indicator, JEDI-2Psub, in PCs (blue) alongside the opsin ChRMine expressed in granule cells (red). d Imaging of 254 × 30 pixel (208 × 24 µm) areas performed at 440 Hz. e 60 s unfiltered ΔF/F0 from a PC dendrite, imaged at 440 Hz. f 2 s unfiltered trace (blue) from the same cell, with baseline filter (red) and detected complex spikes (CS) signals (green). g Single complex spike from the same neuron. h The average of n = 157 spikes from the same neuron, up-sampled to 2 kHz (blue, gray ± 1 std). i Scatter plot comparing baseline fluorescence against peak fluorescence for each CS from a single PC (shaded area represents 95% confidence interval). Fitted by linear regression and tested via a two-sided Wald test. Inset: fitted slope across all cells. j A 25 ms air puff is applied to the whisker pad of the mouse at 0.5 Hz. Shown: the response of three different PCs with the probability, P(spike|puff), of a puff response (n = 60 trials, mean response in black). k CS shape comparison between evoked (green, n = 48 spikes) and spontaneous (blue, n = 243 spikes). l Comparison of the mean spontaneous and sensory-evoked CS amplitude (N = 4 mice, n = 43 cells). Cells marked in green have a significantly larger evoked amplitude (35%), cells marked in blue have a significantly larger spontaneous amplitude (44%), and cells shown in gray are not significant (21%). Two-sided Wilcoxon signed-rank test p = 0.844. m Increasing the optical stimulation intensity increases the IPSP amplitude as shown across a single cell (n = 19 trials, mean response in black). n The mean IPSP response across multiple cells (black, error bars represent ±1 std, n = 15 cells and N = 2 mice). o Gabazine reduces the amplitude of optogenetically induced IPSPs (control ΔF/F0 = 4.1 ± 2.8%, post gabazine ΔF/F0 = 1.6 ± 1.6%, two-sided Wilcoxon signed-rank test p = 1.26 × 10⁴, N = 2 mice, n = 19 cells, mean values ± 1 std). Inset: Gabazine control, single example (average of n = 45 trials).
Fig. 3
Fig. 3. Spatiotemporal analysis of PC dendritic voltage responses distinguishes synaptically-driven and regenerative Ca2+ events.
a Multiple PC dendrites are often recorded in the same FOV (top), revealing correlated CF activity (bottom) in the fluorescent traces (brown). b Cross-correlogram between PCs 2 and 3 shown in (a), overlaid with a Gaussian fit (green) indicating PC2 and PC3 are from the same microzone. Inset: cross-correlogram between PCs 1 and 3 showing no correlation, indicating they are from different microzones. c The magnitude of average optically evoked IPSP amplitude is plotted for all pairs of PCs (i,j) in the same FOV, showing highly correlated IPSP amplitudes between neighboring PCs (R = 0.807, p = 1.90 × 10¹⁰ (fitted by linear regression and tested via a two-sided Wald test); n = 23 FOVs across four mice), which lies in the 99th percentile of correlation coefficients compared with a within-mouse shuffle (shaded area represents 95% confidence interval). d Each dendrite is segmented into ~5 µm sections (top), which reveals variations in responses across the dendrite (bottom, average of n = 380 spikes blue, gray ± 1 std). e Features are extracted from the fluorescence traces on a trial-by-trial basis. f The normalized response of these features is then compared across the length of the dendrite (left), and the coefficient of variation (CV) is calculated for each feature of each cell (right). g The CV is compared for spontaneous complex spike (CS) and sensory-evoked CS (left). On average, spontaneous CS have a moderate, yet significantly larger CV than evoked responses, showing that the evoked responses have more uniform amplitudes (one-sided Wilcoxon signed-rank test, p = 0.037; n = 40 cells across four mice). h The CV is compared for optically evoked IPSPs and spontaneous CS. On average, IPSPs have a significantly larger CV, meaning IPSP responses are more localized than regenerative CS events (one-sided Wilcoxon signed-rank test, p = 8.14 × 10³; n = 40 cells across four mice). Red point marks the PC shown in (f).
Fig. 4
Fig. 4. In vivo plasticity induction triggers LTP of inhibitory responses and normalizes activity across PC dendrites.
a The experimental protocol comprises three stages: the first measures interneuron-PC responses by optogenetically activating GrCs and measuring evoked responses, the second pairs GrC activation with climbing fiber activation, and the third measures the post-pairing response. b Optical stimulation-triggered-average from a representative PC, pre- (blue) and post-pairing (red), n = 60 trials, displayed at 500 Hz. c A histogram of IPSP amplitudes for individual trials for the PC shown in (b), pre- and post-pairing (ΔF/F0 = 14.8 ± 2.8% and 17.6 ± 3.6%, respectively, mean ± std), two-sided Mann–Whitney U-test p = 2.91 × 10⁵. d Mean IPSP amplitude change across all neurons (N = 4 animals, n = 32 neurons), pre- and post-pairing, two-sided Wilcoxon Signed-Rank test, p = 8.80 × 10³. Error bars represent ±1 std. e A histogram of the log amplitude ratio for the pairing condition and the control condition (pairing protocol omitted). The two distributions were compared using a linear mixed-effect model with animal and FOV as random effects (two-sided Wald t-test p = 4.92 × 10⁶). f A scatter plot of potentiation magnitude against pre-pairing IPSP amplitude, for the plasticity and control condition. The magnitude of the plasticity change is negatively correlated with the IPSP amplitude (red) but not for control (gray). Fitted by linear regression and tested via a two-sided Wald test. Shaded area represents 95% confidence interval. g For neighboring PCs (i,j) the magnitude of potentiation is plotted, showing a positive correlation between neighboring PCs (red), but not in a within-mouse shuffle distribution; inset: n = 500 shuffled correlation coefficients R in gray against the measured R (red dashed line; fitted by linear regression and tested via a two-sided Wald test; shaded area represents 95% confidence interval). h The change in IPSP amplitude across different dendritic segments is displayed for two PCs, for the pre- (blue) and post-pairing (red) conditions. Potentiation both increases the IPSP amplitude but decreases the variation in amplitude across the dendrite. i The coefficient of variation (CV) is plotted before and after pairing (left) for all neurons undergoing the plasticity protocol (red) and the control protocol (gray). The plasticity cells are significantly below the line of unity and below control (as shown in the histogram (right), two-sided Mann–Whitney U-test, p = 3.94 × 10³).

References

    1. Luo, L. Principles of Neurobiology 2nd edn (CRC Press/Garland Science, 2020).
    1. Markram, H., Lübke, J., Frotscher, M. & Sakmann, B. Regulation of synaptic efficacy by coincidence of postsynaptic APs and EPSPs. Science275, 213–215 (1997). - PubMed
    1. Bittner, K. C. et al. Conjunctive input processing drives feature selectivity in hippocampal CA1 neurons. Nat. Neurosci.18, 1133–1142 (2015). - PMC - PubMed
    1. Meliza, C. D. & Dan, Y. Receptive-field modification in rat visual cortex induced by paired visual stimulation and single-cell spiking. Neuron49, 183–189 (2006). - PubMed
    1. Jacob, V., Brasier, D. J., Erchova, I., Feldman, D. & Shulz, D. E. Spike timing-dependent synaptic depression in the in vivo barrel cortex of the rat. J. Neurosci.27, 1271–1284 (2007). - PMC - PubMed

LinkOut - more resources