. 2025 Nov;28(11):2201-2216.
doi: 10.1038/s41593-025-02062-6. Epub 2025 Oct 3.

Muscle-derived miR-126 regulates TDP-43 axonal local synthesis and NMJ integrity in ALS models

Affiliations

Muscle-derived miR-126 regulates TDP-43 axonal local synthesis and NMJ integrity in ALS models

Ariel Ionescu et al. Nat Neurosci. 2025 Nov.

Abstract

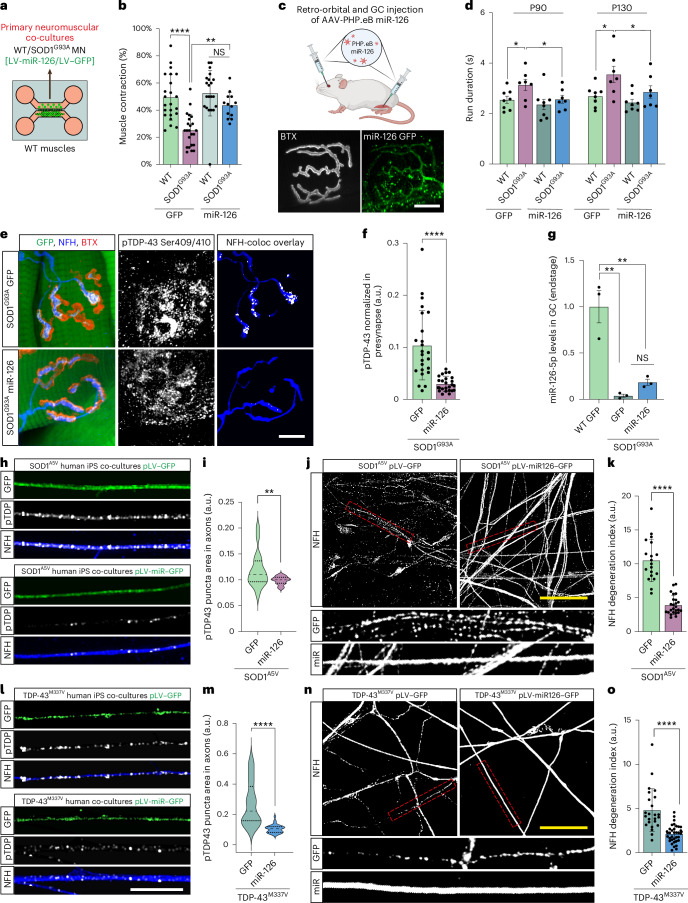
Amyotrophic lateral sclerosis (ALS) is characterized by neuromuscular junction (NMJ) disruption and neurodegeneration. Recent findings highlight a pivotal role for TAR DNA-binding protein 43 (TDP-43) in forming axonal pathological condensates and facilitating NMJ disruption through inhibition of local protein synthesis. However, the mechanisms that drive local TDP-43 accumulation remain unknown. Here we identify that the TDP-43 axonal accumulation in peripheral nerves of SOD1 patients and mice stems from its aberrant local synthesis. This is a non-cell-autonomous process driven by muscle-derived miR-126a-5p extracellular vesicles (EVs). Inhibiting muscle secretion of miR-126a-5p prompts presynaptic TDP-43 synthesis and accumulation, which disrupts axonal translation and causes NMJ degeneration. Introducing miR-126 to SOD1G93A mice, primary co-cultures and human induced pluripotent stem cell (iPSC)-derived co-cultures with ALS mutations exhibits neuroprotective effects and delays motor decline. These findings identify a transcellular communication axis between muscles and motor neurons that regulates axonal local synthesis and NMJ maintenance, offering insights into ALS onset and progression.


Conflict of interest statement

Competing interests: The authors declare no competing interests.

Figures

Fig. 1
Fig. 1. TDP-43 peripheral pathology in SOD1 patients and SOD1 mouse models.
a, Immunohistochemical staining for pTDP-43 in obturator nerve biopsies of non-ALS patients (motor neuropathy), patients with SOD1 (c.442G > A) and patients with sALS. Arrowheads indicate Schwann cells. Scale bar, 10 µm. b, Immunofluorescent staining for pTDP-43 in intramuscular nerves in biopsies of non-ALS patients, patients with SOD1 (c.26T > A) and patients with sALS. White indicates NFH–pTDP-43 co-localization. Scale bar, 5 µm. ce, Immunofluorescent images and quantification of pTDP-43 in sciatic nerve cross-sections of SOD1G93A (d) and SOD1G37R (e) mice and their littermates. White indicates NFH-masked TDP-43. Scale bar, 10 µm. n = 17 (d) and n = 9 (e) nerve sections. *P = 0.0368, ****P = 0.000044. fh, Immunofluorescent images and quantification of TDP-43 in sciatic nerve cross-sections of SOD1G37R (g) and SOD1G93A (h) mice and their littermates. White indicates NFH-masked TDP-43. Scale bar, 10 µm. n = 24, 31 (g) and n = 18, 16 (h) nerve sections. ***P = 0.0006 (g), P = 0.0004 (h). i,j, Representative images and quantification of western blots for TDP-43 (43 kD) and tubulin (55 kD) in sciatic nerve axoplasms of SOD1G93A (i) and SOD1G37R (j) mice versus their littermates. n = 3, 4 mice, respectively. *P = 0.0149 (j), ***P = 0.0002 (i). k,l, Representative images and quantitative analysis for the percent of NMJs with apparent TDP-43/pTDP-43 patch in EDL muscles from P290 SOD1G37R and littermate controls. Red dashed line marks BTX perimeter. Scale bar, 30 µm. n = 3 mice per group. ***P = 0.0009, *P = 0.0288. mp, Immunofluorescent images and quantification of NFH–pTDP-43 co-localization in NMJs of presymptomatic (P60) SOD1G93A (m,n) and (P290) SOD1G37R (o,p) mice versus their littermates. White indicates NFH–pTDP-43 co-localization. Scale bar, 15 µm. n = 29, 20 (n); n = 53, 59 (p) NMJs. ***P = 0.0005 (n), ****P = 0.000019 (p). qt, Representative images and quantification of the OPP labeling in NMJs of presymptomatic (P60) SOD1G93A (q,r) and (P290) SOD1G37R (s,t) mice and their littermates. White indicates OPP–ChAT or OPP–NFH–synaptophysin three-dimensional co-localization. Scale bar, 10 µm. n = 30 (r) and n = 72, 40 (t) NMJs. **P = 0.0032, ****P= 1.21 × 10−6. For d,e,g,h,r,t, data are shown as the mean ± s.d., repeated in three mice per genotype. For i,j,k,l, data are shown as the mean ± s.e.m., repeated in three mice per genotype. For n,p, data are shown in violin density plots with markings of first, median and third quartiles, repeated in three mice per genotype. For d,e,gl,n,p,r,t, two-tailed unpaired Student’s t-test. coloc, co-localization; LM, littermate; SN, sciatic nerve. Source data
Fig. 2
Fig. 2. TDP-43 mRNA localization and local translation in MN axons.
a, Quantitative RT–PCR analysis of the relative mRNA levels of TDP-43 and PolB in RNA preparations from soma or axonal compartments of radial MFCs. n = 3 neuronal cultures; each repeat represents a pool of several radial chambers. RQ, relative quantification. NS = 0.9814, **P = 0.0015. b, Representative image of an agarose gel with cDNA amplicons of TDP-43, PolB and β-actin amplified from sciatic nerve axoplasm RNA. n = 5 mice. c, Representative images of smFISH for mRNA of TDP-43 and β-actin in primary MN axons compared to no probe control. Scale bar, 5 µm. d, Representative images of smFISH for mRNAs of TDP-43 and β-actin in EDL muscle NMJs compared to no probe control. White indicates smFISH–NFH three-dimensional co-localization result. Scale bar, 10 µm. e,f, Representative images and quantification of TDP-43 puro-PLA in axons in the presence or absence of anisomycin (40 µM) and in in vitro NMJs (lowest panel). Scale bars, 20 µm and 5 µm. n = 97, 91, 62 axons and NMJs, respectively. NS = 0.0525, ****P = 3 × 10−15 (Aniso), P = 1.31 × 10−6 (NMJ). g,h, Representative images and orthogonal slices of TDP-43 puro-PLA in EDL NMJs treated with puromycin (g) or with anisomycin + puromycin (h) muscles. i,j, Representative images and orthogonal slices of β-actin puro-PLA labeling in EDL NMJs treated with puromycin (i) or with anisomycin + puromycin (j) muscles. SynP, synaptophysin labeling. Scale bar, 10 µm. For a, data are shown as the mean ± s.e.m., two-way ANOVA with multiple comparisons. For c, representative experiment repeated in three neuronal cultures. For d, representative experiment repeated in three ex vivo muscle preparations. For f, data are shown in violin density plots with markings of first, median and third quartiles, one-way ANOVA with Holm–Sidak correction for multiple comparisons, repeated in three neuronal cultures. Aniso, anisomycin; coloc, co-localization; NS, not significant. Source data
Fig. 3
Fig. 3. Muscles communicate with presynaptic axons via EVs.
ac, Representative images and quantitative analysis (b,c) of NMJ immunolabeling for CD63 (upper panel b) and CHMP2A (lower panel c). Gray indicates three-dimensional co-localization result of CD63/CHMP2A and BTX. Scale bar, 10 µm. n = 19 (b) and n = 39 (c) muscles. ***P = 0.00012 (b), ****P = 1.17 × 10−10 (c). d, Illustration of experimental setup in e and f. Primary skeletal muscles were transfected with CD63-pHluorin vector and co-cultured with primary MNs in compartmental MFCs. e,f, Representative images and quantification of CD63-pHluorin signal and localization in neuromuscular co-cultures. Scale bar, 20 µm. n = 24 muscles from three independent repeats. Two-tailed paired Student’s t-test, **P = 0.0015. g, Representative TEM images of muscle-derived EVs. Scale bars, 300 nm (left panel) and 100 nm (right panel). h, Representative NTA plot for muscle conditioned media. i, Representative images of western blots for CD63 (55 kD), CD81 (26 kD), CD9 (22 kD), Ago2 (87 kD) and TDP-43 (43 kD) in protein lysates of primary muscles and primary muscle-derived EVs. j, Illustration of experimental setup for j. Primary skeletal muscles were transfected with Ago2–GFP vector and co-cultured with primary MNs in compartmental MFCs. k, Upper panel: representative images of immunolabeling for Ago2 and GFP in neuromuscular co-cultures. Lower panel: inset and representative image of Imaris puncta analysis for Ago2 and GFP antibody labeling within axons. Yellow arrowheads indicate co-localized GFP and Ago2 signals in axons. Scale bar, 10 µm. For b,c,f, data are shown as pairs of signal intensity in synaptic versus extra-synaptic regions within the same muscle. For b,c, experiment was repeated in three mice. For f, experiment was repeated in three co-cultures. For b,c,f, two-tailed paired Student’s t-test. For g,h,I, representative for three biological repeats of muscle culture and EV preparation. For k, repeated once. Representative of 15 images. coloc, co-localization; Ex.synaptic, extra-synaptic. Source data
Fig. 4
Fig. 4. Local deregulation of EV-loaded miR-126a-5p in NMJs may directly regulate TDP-43 expression.
a, Volcano plot of small RNA-seq from muscle-derived EVs and whole-cell lysates of muscle cultures. Data are shown as log2FC of EV miRNAs over whole-cell lysates. Blue dots indicate miRNA with log2FC > 0.5 and −log10Padj > 2. n = 3 cultures/isolated EVs. Wald test with correction for multiple comparisons. b, Quantitative TaqMan RT–PCR for miR-126a-5p in whole-cell muscle lysates versus muscle-derived EVs. n = 3 cultures/isolated EVs. **P = 0.0073. c, Representative images of miR-126a-5p FISH in NMJs of EDL muscles. Scale bar, 10 µm. d, TaqMan RT–qPCR analysis of miR-126a-5p levels in GFP-infected and miR-126-infected primary MNs. U6 was used as loading control. n = 3 neuronal cultures. ****P = 0.000014. e, Top, scheme of TDP-43 transcript variant 3 mRNA with marking of the approximate location of two miR-126a-5p binding sites. Bottom, RT–qPCR for mmu-Tardbp transcript variant 3 in primary MNs infected with either empty GFP backbone or miR126–GFP vector. n = 3 neuronal cultures. **P = 0.0046. f,g, Scheme and quantitative analysis (g) of dual-luciferase assay for miR-126a-5p and mmu-Tardbp mRNA interaction. One hundred base pairs (bp) of the 3’ UTR of mmu-Tardbp mRNA, including one miR-126a-5p (wt) or a mutant miR-126a-5p (mut), were inserted into dual-luciferase reporter plasmid. n = 9 replicates from three repeats. ****P = 2.46 × 10−7. h, Representative images and quantification of western blots for TDP-43 (43 kD) in primary MNs infected with GFP or with miR126–GFP vector. Tubulin (55 kD) was used as loading control. n = 4 neuronal cultures. *P = 0.0258. i, TaqMan RT–qPCR analysis for miR-126-5p in serum-derived EVs of patients with sALS (n = 7) and healthy controls (n = 5). ****P = 0.000019. j,k, TaqMan RT–qPCR for miR-126-5p in P60 SOD1G93A GC muscles and P60 SOD1G93A SC (j) and P357 SOD1G37R GC muscles and P357 SOD1G37R SC (k). U6 was used as loading control. n = 3 (SC), n = 3 (j; GC) and n = 6–8 (k; GC) mice in each group. One-tailed (j; GC) or two-tailed (j,k) unpaired t-test, *P (j) < 0.0491, NS (j) = 0.6973, ***P (k) < 0.0004, NS (k) = 0.9591. For b,d,e,hk, data are shown as the mean ± s.e.m. For g, data are shown as the mean ± s.d. For b, two-tailed paired Student’s t-test. For d,e,g,h,i,j (SC),k, two-tailed unpaired Student’s t-test. For j (GC), one-tailed unpaired Student’s t-test. For c, images represent eight repeats in mouse muscles. FC, fold change; CDS, coding sequence; GC, gastrocnemius; mut, mutant; NS, not significant; Padj, adjusted P value; SC, spinal cord; wt, wild-type. Source data
Fig. 5
Fig. 5. Muscle EVs preserve NMJ integrity by regulating TDP-43 synthesis.
a, Representative images of Rab27a in NMJs. Top, NMJ markers; bottom, co-localization of Rab27a with BTX (yellow). Scale bar, 10 µm. b, Experimental setup in c and d. Tet-On shRNA-Rab27 vectors were transfected into primary muscles that were co-cultured in MFCs with primary MNs. At co-culture day 5, doxycycline was added to the muscle compartment. TRE, tetracycline responsive element. c, Representative western blot and quantificaton of Rab27a (29 kD) in primary muscles transfected with Tet-On shRNA-Rab27 +/− doxycycline. Tubulin was used as a loading control. n = 3 muscle cultures. **P < 0.0016. d, Representative NTA histograms comparing size distribution of EVs from Tet-On shRNA-Rab27a transfected primary muscles +/− doxycycline. e, NTA particle concentrations analysis in the EVs above. ****P = 2.43 × 10−7. n = 4 EV preparations from four muscle cultures. f,g, Representative images and quantification of TDP-43 puro-PLA in presynaptic axons in co-cultures with Tet-On shRNA-Rab27a-expressing muscles +/− doxycycline. TDP-43 puro-PLA–NFH co-localization is shown in gray (right). Scale bar, 10 µm. n = 151, 140 NMJs. ****P = 4.2 × 10−14. h,i, Representative images and quantification of OPP labeling in Tet-On shRNA-Rab27a co-cultures +/− doxycycline. OPP–NFH co-localization is shown in gray (right). Scale bar, 10 µm. n = 61, 25 NMJs ****P = 9.75 × 10−6. j, Percent of contracting innervated muscles in Tet-On shRNA-Rab27a co-cultures +/− doxycycline. n = 9, 9, 5 co-cultures. ***P = 0.0004, NS = 0.7059. k,l, Representative images and quantification of NMJ disruption in Tet-On shRNA-Rab27a co-cultures +/− doxycycline. Scale bar, 10 µm. n = 4 co-cultures. **P = 0.0010. m, Representative NTA histogram comparing size distribution of EVs from primary muscles cultured in the presence of 10 µM GW4869 or DMSO in the culture media. n, NTA particle concentration analysis in the EVs above. n = 3 EV preparations from three muscle cultures ****P = 1.28 × 10−6. o, Analysis of TDP-43 puro-PLA in presynaptic axons in DMSO-treated versus GW4860-treated (10 µM) co-cultures. n = 128, 131 NMJs ****P = 3.5 × 10−8. p, Analysis of OPP labeling in DMSO-treated versus GW4860-treated (10 µM) co-cultures. n = 94, 95 NMJs ****P = 4.3 × 10⁻¹⁰. For d,e,i,m,n,p, data are shown as the mean ± s.d., repeated in three independent repeats. For c,j,l, data are shown as the mean ± s.e.m., repeated in three independent repeats. For g,o data are shown in violin density plots with markings of first, median and third quartiles, repeated in three independent repeats. For b,c,e,g,i,l,np, two-tailed unpaired Student’s t-test. For j, one-way ANOVA with Holm–Sidak correction for multiple comparisons. coloc, co-localization; Dox, doxycycline; NS, not significant. Source data
Fig. 6
Fig. 6. Postsynaptic miR-126a-5p preserves NMJ integrity via regulation of TDP-43 expression in axons.
a, RT-qPCR for TDP-43 mRNA in primary muscles 5 days after miR126i treatment. GAPDH was used as loading control. RQ, relative quantification. n = 3 cultures *P = 0.0203. b, Illustration of experimental setup in ck. Neuromuscular compartment in co-cultures was exclusively transfected at day 5 with miR126i. c,d, Representative images and analysis of TDP-43 density (puncta/100 µm) in axons within the neuromuscular compartment in control versus miR126i-treated co-cultures 5 days after transfection. Scale bar, 5 µm. n = 222, 216 axons. ****P < 1 × 10−15. e,f, Representative images and quantification of TDP-43 puro-PLA signal in presynaptic axons in control and miR126i-treated co-cultures. White indicates TDP-43 puro-PLA–NFH co-localization (right). Scale bar, 10 µm. n = 62, 80 NMJs. ****P = 3.39 × 10−13. g,h, Representative images and quantification of OPP labeling in control and miR126i-treated co-cultures. White indicates OPP–NFH co-localization (right). Scale bar, 10 µm. n = 259, 212 NMJs ****P = 1.12 × 10−7. i, Percent of contracting innervated muscles in control and miR126i-treated co-cultures. n = 13, 15 co-cultures. ***P = 0.00014. j,k, Representative image and quantification of NMJ disruption in control and miR126i-treated co-cultures. Scale bar, 10 µm. n = 13, 15 microfluidic co-cultures. **P = 0.0084. l,m, Representative images and quantification of axonal TDP-43 density in control-siRNA-treated or TDP-43-siRNA-treated co-cultures in presence/absence of miR126i. Scale bar, 10 µm. n = 96, 89, 70, 73 axons. Control siRNA versus miR126i+control siRNA: ****P = 4.15 × 10−10; miR126i+control siRNA versus miR126i+TDP-43 siRNA: ****P = 1.05 × 10−7. n, Representative images of NMJs in control-siRNA-treated or TDP-43-siRNA-treated co-cultures in presence/absence of miR126i. Scale bar, 10 µm. o, Percent of axon degeneration in co-cultures treated as described above. n = 3 co-cultures. Control siRNA versus miR126i+control siRNA: *P = 0.0296; miR126i+control siRNA versus miR126i+TDP-43 siRNA: *P = 0.0296. For h,I, data are shown as the mean ± s.d., repeated in three independent repeats. For a,k,o, data are shown as the mean ± s.e.m., repeated in three independent repeats. For d,f,m, data are shown in violin density plots with markings of first, median and third quartiles, repeated in three independent repeats. For a,d,f,h,i,k, two-tailed unpaired Student’s t-test. For m,o, one-way ANOVA with Holm–Sidak correction for multiple comparisons. In eo, miR126i or siRNA was administered exclusively to the neuromuscular compartment. coloc, co-localization. Source data
Fig. 7
Fig. 7. miR-126 overexpression preserves motor functions in ALS models via regulation of presynaptic TDP-43 expression.
a, Illustration of experimental setup in b. GFP-infected or miR-126–GFP-infected primary MNs were co-cultured with primary skeletal muscles. b, Percent of contracting muscles at tenth day of co-culture. n = 23, 23, 21, 13 co-cultures, NS = 0.3070, **P = 0.0026, ****P = 1.54 × 10−6, NS = 0.307. c, Illustration of experimental setup for dg. SOD1G93A and littermate mice (P60) were injected with PHP.eB miR126–GFP or GFP-only AAV retro-orbitally and to the right gastrocnemius muscle. Bottom, representative image of an NMJ in the left gastrocnemius muscle of littermate miR126–GFP-injected mouse. Scale bar, 10 µm. d, Run duration analysis for GFP-infected and miR126–GFP-infected WT and SOD1G93A mice at P90 and P130. n = 8 mice in each group. WT+GFP versus SOD1G93A+GFP *P = 0.0193, SOD1G93A+GFP versus SOD1G93A+miR126 *P = 0.0287; P130: WT+GFP versus SOD1G93A+GFP *P = 0.0172, SOD1G93A+GFP versus SOD1G93A+miR126 *P = 0.0359. e,f, Representative images and quantification of pTDP-43 in presynaptic axons in NMJs of GFP-infected and miR-126–GFP-infected SOD1G93A mice at disease endstage. White indicates pTDP-43–NFH three-dimensional co-localization (rightmost). Scale bar, 10 µm. n = 24, 31 NMJs. ****P = 2 × 10−6. g, miR-126a-5p RT–qPCR in right gastrocnemius muscles of GFP-treated and miR-126-treated SOD1G93A compared to littermate–GFP-treated muscles. **P = 0.0028, NS = 0.3570. h,i, Representative images and analysis of pTDP-43 density in distal axons of pLV-hSyn–GFP-infected or pLV-hSyn-miR126–GFP-infected SOD1A5V iPSC–MN co-cultures with SOD1A5V iPSC-muscles expressing similar plasmids under CMV promoter. Scale bar, 5 µm. n = 18, 24 images. **P = 0.0082. j,k, Representative images and analysis of axonal degeneration index in the neuromuscular compartment of SOD1A5V co-cultures expressing the above vectors. Scale bar, 20 µm. n = 19, 25 ****P = 6 × 10−12. l,m, Representative images and analysis of pTDP-43 density in distal axons TDP-43M337V iPSC-derived MN-muscle co-cultures expressing the same vectors. Scale bar, 5 µm. n = 26, 36 images. ****P = 7.88 × 10−9. n,o, Representative images and analysis of axonal degeneration index within the distal compartment of above TDP-43M337V co-cultures. Scale bar, 20 µm. n = 24, 36 ****P = 1.16 × 10−7. For f,j,o, data are shown as the mean ± s.d., repeated in three mice per genotype or three independent repeats. For b,d,g, data are shown as the mean ± s.e.m., repeated in three mice per genotype. For i,m, data are shown in violin density plots with markings of first, median and third quartiles, repeated in three independent repeats. For d (P90), multiple unpaired one-tailed Student’s t-tests. For f,g,i,k,m,o, two-tailed unpaired Student’s t-test. For b,d (P130), one-way ANOVA with Holm–Sidak correction. LV, lentivirus; NS, not significant; s, seconds; WT, wild-type. Source data
Fig. 8
Fig. 8. Graphical abstract.
Local protein synthesis in presynaptic motor axons is a key process essential for the function, maintenance and survival of NMJs. To function properly, local protein synthesis depends on mRNA availability, which is controlled by anterograde axonal transport and local ribonucleoproteins. We identified that muscle-derived miR-126a-5p is enriched in NMJs and regulates the translation of TDP-43 mRNA in presynaptic axons through EVs. Deregulation of muscle-derived miR-126a-5p releases the inhibition of TDP-43 mRNA, leading to its local translation and accumulation in the presynaptic axon, thereby facilitating NMJ disruption via TDP-43-mediated local translation arrest.
Extended Data Fig. 1
Extended Data Fig. 1. TDP-43 peripheral pathology in SOD1 patients and SOD1 mouse models.
a) Immunofluorescent staining for pTDP-43 in intramuscular nerves within muscle biopsies of non-ALS (spinal stenosis), SOD1 (c.26T > A), and sALS patients. Blue indicates NFH, Gray indicates pTDP-43 and colocalized pTDP-43 within NFH positive nerves (in the respective panel). Scale bar: 5 µm. b) Representative immunofluorescent images of TDP-43 in sciatic nerve longitudinal sections of SOD1G93A mice and their littermates (LM). Gray indicates TDP-43 and NFH-masked TDP-43 (in the respective panel), blue indicates NFH. Scale bar: 10 µm. c) Representative images of TDP-43 immunolabeling in sciatic nerve cross sections of p290 SOD1G37R mice and their littermates. Gray indicates TDP-43 and NFH-masked TDP-43 (in the respective panel), blue indicates NFH, yellow indicates S100β. Scale bar: 10 µm. d) Quantitative analysis of TDP-43 intensity within S100β region in sciatic nerve sections of p290 SOD1G37R mice and their littermates. Data is shown as the mean TDP-43 intensity in S100β mask ± SD. n = 26; 29 images from 3 mice in each condition. Two-tailed unpaired student’s t-test. ****p = 2.11×10⁻⁶. e) Representative images of pTDP-43 immunolabeling in sciatic nerve cross sections of p290 SOD1G37R mice and their littermates. Gray indicates pTDP-43 and NFH-masked pTDP-43 (in the respective panel), blue indicates NFH, yellow indicates S100β. Scale bar: 10 µm. f) Quantitative analysis of pTDP-43 intensity within S100β region in sciatic nerve sections of p290 SOD1G37R mice and their littermates. Data is shown as the mean pTDP-43 intensity in S100β mask ± SD. n = 27; 29 images from 3 mice in each condition. Two-tailed unpaired student’s t-test. **p = 0.0018. For a, immunofluorescent labeling for pTDP-43 in SOD1 patient repeated once for 1 patient. Labeling on non-ALS and ALS patients was repeated for 6 patients and 6 healthy controls. For b, representative images of experiment repeated in 3 mice per genotype.
Extended Data Fig. 2
Extended Data Fig. 2. TDP-43 Peripheral pathology in SOD1 mouse models.
a) Western blots of sciatic nerve axoplasms from 3 p120 B6SJL.SOD1G93A and 3 littermates for TDP-43 (43kD), pTDP-43 (43kD) and hSOD1 (17kD). Tubulin (55kD) was used as a loading control. A distinct 25kD additional band was observed in the TDP-43 blot of SOD1G93A samples, suggested to be C-terminal fragments, as previously reported. b) Quantitative analysis of the pTDP-43/tubulin intensities within blots from sciatic nerve axoplasms of p120 B6SJL.SOD1G93A and littermates. n = 3 mice in each condition. Two-tailed unpaired student’s t-test, p = 0.5146. c) Representative western blot image and quantitative analysis of the TDP-43/tubulin intensities within blots from sciatic nerve axoplasms of p110 B6.SOD1G93A and littermates. n = 3 mice in each condition. TDP-43 (43kD), Tubulin (55kD). Two-tailed unpaired student’s t-test. n = 0.0582. d) Western blots of sciatic nerve axoplasms from 3 p357 SOD1G37R and 3 littermates for TDP-43 (43kD), pTDP-43 (43kD) and hSOD1 (17kD). Tubulin (55kD) was used as a loading control. A distinct 25kD additional band was observed in the TDP-43 blot of SOD1G37R samples, suggested to be C-terminal fragments as previously reported. e, f) Quantitative analysis of TDP-43/tubulin (e) and pTDP-43/tubulin (f) in sciatic nerve axoplasms of p357 SOD1G37R and littermates. n = 3 mice in each condition. Two-tailed unpaired student’s t-test, **p = 0.0081, *p < 0.0118. g) Western blots of gastrocnemius muscle lysates from 3 p120 B6SJL.SOD1G93A and 3 littermates for TDP-43 (43kD), pTDP-43 (43kD) and hSOD1 (17kD). Tubulin (55kD) was used as a loading control. h, i) Quantitative analysis of TDP-43/tubulin (h) and pTDP-43/tubulin (i) background subtracted thus the negative values in gastrocnemius muscles of B6SJL.SOD1G93A and littermates. n = 3 mice in each condition. Two-tailed unpaired student’s t-test, p = 0.1348(h), *p = 0.0355(i). j, k) Representative images and quantitative analyses of TDP-43/tubulin in gastrocnemius muscle lysates from p290 SOD1G37R (j) and P110 B6.SOD1G93A (k) mice versus their littermates. TDP-43 (43kD), Tubulin (55kD). n = 4 mice per condition (j); n = 3 mice per condition (k). Two-tailed, unpaired student’s t-test. **p = 0.0038(j), p = 0.7216(k).
Extended Data Fig. 3
Extended Data Fig. 3. TDP-43 pathology is non apparent in spinal cords of SOD1 mouse models.
a) Representative images and quantitative analysis of TDP-43/tubulin in spinal cord lysates from p110 B6.SOD1G93A mice and their littermates. TDP-43 (43kD), Tubulin (55kD). n = 4 mice per condition. Two-tailed, unpaired student’s t-test. p = 0.7451 b, c) Representative images (b) and quantitative analysis (c) for the percent of ventral motor neurons with nuclear pTDP-43 in spinal cords of p120 B6SJL.SOD1G93A mice and their littermates. Data are shown as the mean percent of ventral motor neurons with nuclear pTDP-43 ± SEM. n = 3 mice in each condition. Yellow indicates pTDP-43, blue indicates nuclei (DAPI), red indicates NeuN. Scale bars: 10 µm. d) Representative images and quantitative analysis of TDP-43/tubulin in spinal cord lysates from p290 SOD1G37R mice and their littermates. TDP-43 (43kD), Tubulin (55kD). n = 3 mice per condition. Two-tailed, unpaired student’s t-test. p = 0.2462 e, f) Representative images (e) and quantitative analysis (f) for the percent of ventral motor neurons with nuclear pTDP-43 in spinal cords of p290 SOD1G37R mice and their littermates. Data are shown as the mean percent of ventral motor neurons with nuclear pTDP-43 ± SEM. n = 3 mice in each condition. Yellow indicates pTDP-43, blue indicates nuclei (DAPI), red indicates NeuN. Scale bars: 10 µm. g–i) Representative images (g) and quantitative analysis (h-i) for the percent of ventral motor neurons with cytoplasmic (h) or nuclear (i) pTDP-43 in spinal cords of induced (-Dox; 2 weeks) TDP43∆NLS mice and non-induced controls (+Dox). Data are shown as the mean percent of ventral motor neurons with cytoplasmic/nuclear pTDP-43 ± SEM. n = 3 mice in each condition. Two-tailed student’s t-test, ***p = 0.0004(h), *p = 0.0293(i). Yellow indicates pTDP-43, blue indicates nuclei (DAPI), red indicates NeuN. Scale bars: 10 µm. j) Quantitative distribution analysis for the percent of ventral motor neurons with either nuclear TDP-43, cytoplasmic TDP-43 or equally distributed TDP-43 in spinal cords of p290 SOD1G37R mice and their littermates. Data are shown as the mean percent of TDP-43 positive neurons in the respective subcellular region ± SEM. Multiple unpaired t-test. p = 0.8013(mainly nuclear), p = 0.802(equally distributed) n = 3 mice from each condition.
Extended Data Fig. 4
Extended Data Fig. 4. Comparison of TDP-43 and pTDP-43 accumulation in NMJs of fast versus slow muscle fibers in SOD1 mouse models.
a) Representative immunofluorescent images of TDP-43 localization in NMJs from gastrocnemius muscle of induced TDP43∆NLS (-Dox; 2-weeks) and non-induced control (+Dox). Gray indicates TDP-43 and TDP-43:NFH 3D colocalization result (in the respective panel), blue indicates NFH, red indicates BTX. Scale bar: 10 µm. experiment repeated in 5 mice per genotype. b) Representative immunofluorescent images of pTDP-43 localization in NMJs from EDL muscle of p60 B6SJL.SOD1G93A and littermate control mice. Gray indicates pTDP-43 and pTDP-43:NFH 3D colocalization result (in the respective panel), blue indicates NFH, red indicates BTX. Scale bar: 10 µm. experiment repeated in 3 mice per genotype. c) Representative immunofluorescent images of pTDP-43 localization in NMJs from EDL muscle of p290 SOD1G37R and littermate control mice. Gray indicates pTDP-43 and pTDP-43:NFH 3D colocalization result (in the respective panel), blue indicates NFH, red indicates BTX. Scale bar: 10 µm. experiment repeated in 3 mice per genotype. d, e) Representative immunofluorescent images (d) and quantitative analysis (e) of TDP-43 in NMJs from EDL muscle of p290 SOD1G37R and littermate control mice. Gray indicates TDP-43 and TDP-43:NFH 3D colocalization result (in the respective panel), blue indicates NFH, red indicates BTX. Scale bar: 10 µm. Data are shown in violin density plots with markings of first, median and third quartiles of mean TDP-43 intensity to NFH/Synaptophysin intensity in NMJs. Two-tail unpaired student’s t-test. ****p = 2.57×10⁻⁵. n = 38 NMJs from 3 mice per condition. f) Quantitative analysis of the percent of pTDP-43 colocalization area in presynapses at NMJs of P60 B6SJL.SOD1G93A. Two-tail unpaired student’s t-test. **p = 0.0071. n = 33;21 NMJs from 3 mice per condition. g, h) Representative immunofluorescent images (g) and quantitative analysis (h) of pTDP-43 in NMJs from EDL muscle of p90 B6SJL.SOD1G93A and littermate control mice. Gray indicates pTDP-43 and pTDP-43:NFH 3D colocalization result (in the respective panel), blue indicates NFH, red indicates BTX. Scale bar: 10 µm. Data are shown in violin density plots with markings of first, median and third quartiles of mean pTDP-43 intensity to NFH intensity (left panel) or percent of pTDP-43 colocalization area in presynapses at NMJs. Two-tail unpaired student’s t-test. **p = 0.0021(pTDP-43 intensity), ****p = 4.8×10⁻⁹ (pTDP-43 area). n = 39;36 NMJs from 3 mice per condition. i, j) Representative immunofluorescent images of TDP-43 (i) and pTDP-43 (j) localization in NMJs from soleus muscles of p290 SOD1G37R and littermate control mice. Gray indicates TDP-43 and TDP-43:NFH 3D colocalization result (in the respective panel), blue indicates NFH, red indicates BTX. Scale bar: 10 µm. k) Quantitative analysis for the percent of NMJs with apparent TDP-43/pTDP-43 patch in soleus muscles from p290 SOD1G37R and littermate controls. Data are shown as the mean percent of NMJs with TDP-43 (left panel) or pTDP-43 (right panel) patch ± SEM. n = 3 mice per group. Two-tailed, unpaired t-test. p = 0.0746(TDP-43), p = 0.0636(pTDP-43). l) Quantitative analysis of TDP-43 (left panel) and pTDP-43 (right panel) intensity in NMJs from soleus muscle of p290 SOD1G37R and littermate control mice. Data are shown in violin density plots with markings of first, median and third quartiles of mean TDP-43 (left) or pTDP-43 (right) intensity to NFH/Synaptophysin intensity in NMJs. Two-tail unpaired student’s t-test. n = 44;41 (TDP-43), n = 82,52 (pTDP-43) NMJs from 3 mice per condition. ****p = 5.295×10⁻⁵ (TDP-43), p = 0.0899(pTDP-43).
Extended Data Fig. 5
Extended Data Fig. 5. TDP-43 mRNA localization and local translation in motor neuron axons.
a) Relative mRNA transcript levels in axons versus cell-bodies (soma) of Tardbp, Elavl1, Stau1, and Actb. Data are shown as fold change (F.C) of normalized counts in axons over soma for each mRNA transcript. Raw data reanalysis of axonal and soma RNA-seq from primary motor neurons (Rotem et al., 2017). b) Representative images of smFISH for β-actin and TDP-43 mRNAs compared with no probe control in primary motor neuron cell bodies. Gray indicates RNA FISH, green indicates phalloidin/HB9:GFP, blue indicates nuclei (DAPI). Red dashed line marks proximal axon shown in magnified insets. Scale bar: 15 µm. Experiment performed in 3 neuronal cultures. c-d) Representative images (c) and quantitative analysis (d) of TDP-43 immunolabeling of distal axons in MFC 4 days after localized transfection with TDP-43 siRNA mix or with control siRNA. Magenta indicates TDP-43, green indicates NFH. Scale bar: 10 µm. Data are shown in violin density plots with markings of first, median and third quartiles of mean number of TDP-43 puncta in 100 µm axons. Two-tailed unpaired student’s t-test. ****p < 1 × 10⁻¹⁴. n = 94;87 axons from 3 independently grown co-cultures. e) Representative immunofluorescent images of TDP-43 puro-PLA in a growth cone at a premature NMJ, and in a mature NMJ in healthy co-cultures. Blue indicates NFH, gray indicates BTX, yellow indicates TDP-43 puro-PLA, white dashed line indicates skeletal muscle margins (in NMJ panel, the entire region is over a skeletal muscle) Scale bar: 5 µm. Experiment repeated in 3 neuromuscular co-cultures.
Extended Data Fig. 6
Extended Data Fig. 6. Enrichment of extracellular vesicle machinery in post-synaptic apparatus of NMJs.
a) Representative images for the localization of CD63 (upper panel), CD81 (mid panel) and CHMP2A (lower panel) in healthy GC muscle NMJs. Blue indicates NFH, red indicates BTX, Dynamic blue-green-yellow indicates CD63/CD81/CHMP2A according to raw fluorescent intensity (blue=low; yellow=high). Scale bar: 10 µm. Experiment repeated 3 times (CD63, CD81) and 6 times for CHMP2A. b) Representative images for the localization of CD63 (upper panel), CD81 (lower panel) in NMJs within dissociated muscle fibers following enzymatic digestion of surrounding cells and connective tissues. Red indicates BTX, Dynamic blue-green-yellow indicates CD63/CD81 according to raw fluorescent intensity (blue=low; yellow=high). Scale bar: 10 µm. Experiment repeated 3 times. c) Quantitative analysis of CD81 raw fluorescent signal in synaptic versus extrasynaptic regions within the same muscle fiber. Two-tail paired student’s t-test. ****p = 7.68 × 10⁻⁵. n = 20 muscle fibers from 3 mice d) Representative images and 3D Imaris puncta colocalization analysis of extracellular vesicle machinery in postsynaptic apparatus of enzymatically denervated EDL muscle. White indicates BTX, yellow indicates CD-63, magenta indicates CD-81. Imaris puncta analysis was performed on BTX colocalization channels with CD-63 and CD-81. Scale bar: 10 µm. Experiment performed once. e) Representative max intensity projected (MIP) low magnification images (upper panel) and high magnification images of BTX-positive region (lower panel) of CD63-pHluorin signal in cultured primary muscle before (pre) and immediately after application of ammonium chloride (NH4Cl). Dynamic magenta-orange-white indicates CD63-pHluorin intensity in low magnification images. Lower panel: magenta indicates BTX, green indicates CD63-pHluorin signal. Scale bars: 50 µm; 10 µm in upper and lower panels respectively. Experiment repeated in 2 neuromuscular co-cultures.
Extended Data Fig. 7
Extended Data Fig. 7. miR-126a-5p regulates the mRNA of several predicted targets including the mouse and human mRNA of TDP-43, and is dysregulated in SOD1 NMJs.
a) Representative images of a 6DIV primary motor neuron culture infected with lentiviral (pLV) miR-126 GFP. Green indicates GFP. Scale bar: 100 µm. Repeated in 3 neuronal cultures. b) Quantitative RT-PCR for multiple predicted and non-predicted mouse mRNA targets of miR-126a-5p in primary motor neurons expressing LV-GFP versus LV-miR126-GFP. Data are shown as the mean relative expression of each target in LV-miR126-GFP over LV-GFP ± SEM. Two-way ANOVA with Holm-Sidak correction for multiple comparisons. n = 3 neuronal cultures per condition. p = 0.0003(TDP-43), p = 0.0286(C9orf72), p = 8.78 × 10⁻⁵(Caspase-3), p = 0.012(NRP1), p = 0.0003(DLK1), p = 0.0016(JNK3), p = 0.7869(FUS1), p = 0.0017(CRMP4), p = 0.999(SOD1), p = 0.999(G3BP1), p = 0.9346(Sema3A), p = 0.999(COX4), p = 0.992(COX7). c) Graphical illustrations of the human TDP-43 mRNA and two more predicted isoforms. Green indicates 3’UTRs, red marks the putative miR-126-5p target sites. d) Representative low magnification image of healthy IPSC-derived motor neurons (IPSC-MN; KOLF) infected with pLV-hSyn-miR126. Red indicates GFP in infected neurons. Scale bar: 150 µm. image e) Quantitative Taqman RT-PCR for miR-126-5p in human IPSC-MN (KOLF) expressing either pLV-Syn-miR126-GFP or pLV-Syn-GFP. Data are shown as the mean relative miR-126-5p expression ± SEM in miR-126 infected IPSC-derived motor neurons versus GFP infected ones. Two-tailed unpaired student’s t-test. n = 3 seperatly grown cultures. *p = 0.0162. f) Quantitative RT-PCR for human TDP-43 mRNA with primers targeting the coding sequence (CDS) in IPSC-derived motor neurons following 7 days of pLV-Syn-miR126 or pLV-Syn-GFP infection. Data are shown as the mean relative mRNA levels of human TDP-43 mRNA ± SEM. Two-tailed unpaired student’s t-test. n = 3 separately grown cultures. **p < 0.0042. g) Quantitative TaqMan RT-PCR for miR-126-5p in p290 SOD1G37R GC muscles versus p290 SOD1G37R SC. Data are shown as the mean relative level of miR-126-5p ± SEM. U6 was used as endogenous loading control. Two-tailed unpaired t-test. n = 5 mice in each group. *p = 0.0263(GC), p = 0.888(SC). h-i) Representative images (h) and quantification (i) of miR-126a-5p FISH in NMJs of p60 B6SJL.SOD1G93A EDL muscles versus littermate controls. Blue indicates nuclei (DAPI), green indicates NFH, magenta indicates miR-126a-5p FISH. Scale bar: 10 µm. Data are shown in violin distribution plots of the miR-126a-5p puncta per NMJ with markings of first, median and third quartiles. Two-tailed unpaired student’s t-test. n = 15; 33 NMJs from 3 mice in each condition. ****p = 3.689 × 10⁻⁷.
Extended Data Fig. 8
Extended Data Fig. 8. miR-126-5p enhances neuronal growth of SOD1G93A primary motor neurons.
a–c) Representative phase images with axonal marking (a) and quantification of neurite length (b) and cell-body cluster area (c) in WT, SOD1G93A or miR-126-GFP infected-SOD1G93A primary motor neurons at 3DIV. Blue, red and green segmented lines indicate the neurite tracing. Scale bar: 100 µm. Data are shown as the mean neurite length/cell body cluster area (mm/mm2) ± SEM (c), or cell body cluster area (area/mm2) ± SEM (d). n = 10; 15; 15 wells (over 6,000 neurons analyzed in every condition). One-way ANOVA with Holm-Sidak correction, **p = 0.00942(b), ****p = 0.00002(b), p = 0.1065(b), ****p = 5.41×10⁻⁸(c), *p = 0.0467. d) Representative image of pLV-miR-126 GFP infected primary motor neurons cultured in the proximal compartment of microfluidic chambers. Green indicates GFP. Scale bar: 100 µm.
Extended Data Fig. 9
Extended Data Fig. 9. miR-126a-5p overexpression in vivo.
a-b) Representative images of sciatic nerve cross section (a) and phrenic nerve in the diaphragm (b) of control animals injected with AAV PhP.Eb miR-126 viral particles. Green indicates GFP, red indicates NFH. Scale bars: 200 µm. c) Quantitative Taqman RT-PCR analysis of miR-126a-5p expression in SC, GC and brains of GFP-infected versus miR126-infected healthy mice. Data are shown as the mean relative miR-126a-5p level ± SEM. n = 3 mice in each condition. Two-tailed unpaired student’s t-test, *p = 0.0135(SC), 0.026(GC), 0.0363(Brain). d-e) Catwalk gait analysis of WT and SOD1G93A mice infected with either GFP or miR126, at symptomatic (p90) and late symptomatic (p130) stages. Data are shown as the mean stand duration (d; seconds) and % base of support on 4 limbs (e). n = 8 mice in each group. One-way ANOVA with Holm-Sidak correction. *p = 0.0277(d; p90; WT-GFP vs. SOD-GFP, and SOD1-GFP vs. SOD1-miR), p = 0.2587(d; p130; WT-GFP vs. SOD-GFP, and SOD1-GFP vs. SOD1-miR), **p = 0.0091(e; p90; WT-GFP vs. SOD-GFP, and SOD1-GFP vs. SOD1-miR), *p = 0.0143(e; p130; WT-GFP vs. SOD-GFP, and SOD1-GFP vs. SOD1-miR). f, g) Representative images (f) and quantification (g) of the hindlimb splay reflex in SOD1G93A mice and their littermates infected with either AAV PhP.Eb GFP, or with AAV PhP.Eb miR-126-GFP. Data are shown as the percent of mice who presented normal splay reflex ± SEM. n = 8; 8; 7; 7 mice in each group. Non-parametric Kruskal-Wallis test, *p < 0.02(WT-GFP vs. SOD1-GFP), *p = 0.0258(SOD1-GFP vs. SOD1-miR). h, i) In vivo longitudinal tracking of mouse weight (h) and survival (i) in all experimental groups. In (h), data are shown as the mean weight gain/loss at every timepoint compared with weight on injection day ± SEM. In (i), data are shown in a Kaplan-Maier survival curve starting at p150 (age of mice). n = (8,8;WT),(7,7;SOD1G93A) mice in each group. For a,b – images are representative for 3 similarly injected mice.
Extended Data Fig. 10
Extended Data Fig. 10. IPSC-derived co-culture differentiation and NMJ formation.
a) Representative images from the distal (NMJ) compartment IPSCC-derived co-culture of healthy (KOLF) motor neurons and skeletal muscles. Blue indicates NFH, gray indicates BTX, magenta indicates Titin. White dashed line indicates NMJ region shown in inset. Scale bar: 20 µm. b-c) Quantitative analysis of axonal pTDP-43 fraction (b) and axonal degeneration index (c) in iPSC-derived co-cultures of SOD1A5V, TDP-43M337V, and their isogenic control (KOLF). Data in (b) are shown in violin density plots of pTDP-43 puncta area out of NFH area of axons at the NMJ compartment with marking of first, median, and third quartiles. n = 21; 26, 18 imaging fields from 3 independently grown neuromuscular co-cultures. One-way ANOVA with Holm-Sidak correction. **p = 0.0064, ****p = 4.4 × 10⁻¹⁰. Data in (c) are shown as the mean NFH degeneration index of axons in the NMJ compartment ± SD. n = 28; 23; 18 imaging fields from 3 neuromuscular co-cultures. One-way ANOVA with Holm-Sidak correction. ****p = 4.66 × 10⁻⁵(SOD1A5V), 1.96 × 10⁻⁵(TDP43M337V). d) Representative image for lentivirus-infected IPSC-MN and IPSC-muscles in co-culture within MFC. Green in IPSC-MN (upper compartment) indicates pLV-hSyn-miR126-GFP, Green in IPSC-muscles (lower compartment) indicates pLV-CMV-miR126-GFP. Scale bar: 150 µm. e) Representative immunofluorescent images for pTDP-43 nuclear localization in SOD1A5V and TDP-43M337V IPSC-MN in the proximal MFC compartment of co-cultures infected with either pLV-hSyn-GFP or pLV-hSyn-miR126-GFP. Blue indicates NFH, gray indicates pTDP-43. White dashed square marks the IPSC-MN magnified in the inset. Scale bar: 20 µm. For a,d,e experiments repeated in 3 neuromuscular co-cultures.

References

    1. Peters, O. M., Ghasemi, M. & Brown, R. H. Emerging mechanisms of molecular pathology in ALS. J. Clin. Invest.125, 1767–1779 (2015). - PMC - PubMed
    1. Fischer, L. R. et al. Amyotrophic lateral sclerosis is a distal axonopathy: evidence in mice and man. Exp. Neurol.185, 232–240 (2004). - PubMed
    1. Frey, D. et al. Early and selective loss of neuromuscular synapse subtypes with low sprouting competence in motoneuron diseases. J. Neurosci.20, 2534–2542 (2000). - PMC - PubMed
    1. Moloney, E. B., de Winter, F. & Verhaagen, J. ALS as a distal axonopathy: molecular mechanisms affecting neuromuscular junction stability in the presymptomatic stages of the disease. Front. Neurosci.8, 252 (2014). - PMC - PubMed
    1. Taylor, J. P., Brown, R. H. & Cleveland, D. W. Decoding ALS: from genes to mechanism. Nature539, 197–206 (2016). - PMC - PubMed

MeSH terms