. 2025 Oct 3;15(1):34563.
doi: 10.1038/s41598-025-17956-5.

Development of cognitive, motor, metabolic, and mutant huntingtin aggregation in the zQ175 mouse model of Huntington's disease

Affiliations

Development of cognitive, motor, metabolic, and mutant huntingtin aggregation in the zQ175 mouse model of Huntington's disease

Fiona H McLean et al. Sci Rep. .

Abstract

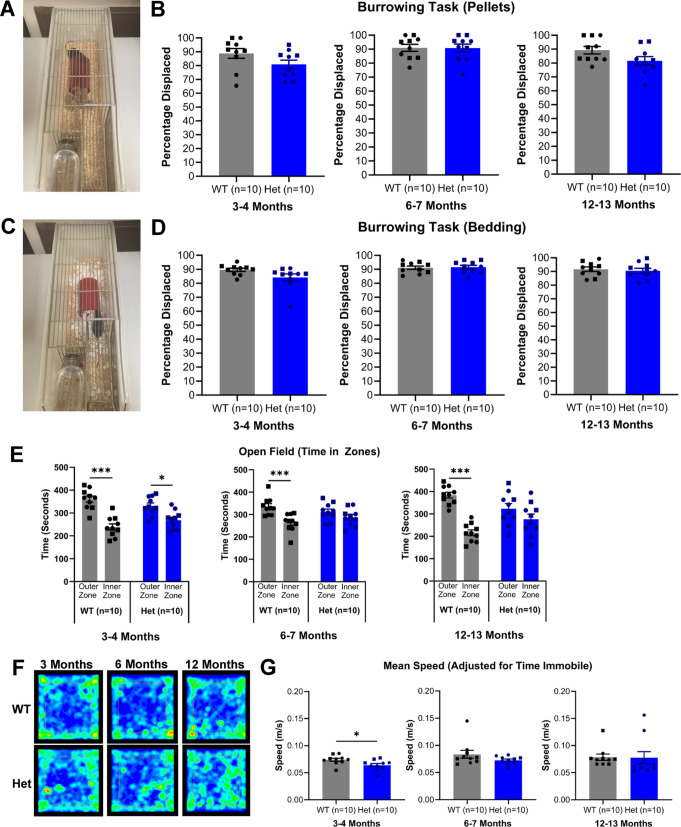
Huntington's disease (HD) is an inherited neurodegenerative disease. In humans, the clinical diagnosis is often dependent on the emergence of motor symptoms. However, cognitive impairments and metabolic changes can be early indicators. HD mouse models are a useful tool to understand disease progression, however, relatively few studies have monitored the timeline for the emergence of cognitive indices with motor and metabolic phenotypes in parallel. In this study, cognitive, motor, and metabolic phenotypes were investigated at different ages in the zQ175 knock-in mouse alongside immunohistochemical and long-term potentiation (LTP) studies. We demonstrated that zQ175 mice developed impaired hippocampal LTP at 3-months and cognitive deficits in visuospatial attention were evident by 4-months. Long-term and spatial memory impairments emerged by 12-months, alongside motor impairments. Additionally, an anxiolytic-like phenotype emerged at 6-months. Differences in body weight were also detected from 6-months onwards, primarily driven by a reduction in fat mass. Additionally, reduced brain weight and the presence of huntingtin aggregates in the hippocampus, striatum and hypothalamus were observed at 12-months. These data support the zQ175 mouse as a model of HD, which recapitulates many aspects of the disease progression in humans and can be used to understand mechanisms underlying the disease.


Conflict of interest statement

Competing interests: The authors declare no competing interests.

Figures

Fig. 1
Fig. 1
Schematic timeline of zQ175 mouse phenotype. Created in BioRender. McLean, F. (2025) (https://BioRender.com/d9uxcba).
Fig. 2
Fig. 2
Cognitive tasks in wild-type and heterozygous zQ175 mice. (A) Representative image of 9-hole box apparatus for operant testing. (B) Schematic image depicting the basic requirements for response accuracy in the 5CSRTT. Mice attended the 9-hole array then detected a stimulus light that flashed for 1 second. Following this, mice were required to nose poke in the hole to obtain a reward. (C) Response accuracy was impaired in Het mice relative to WT. (D) Reaction time was impaired in Het mice relative to WT. (E) Het mice completed fewer trials than WT mice. (F) Het mice omitted responses more often than WT mice. (G) There were no differences in the rate of perseverative responding between WT and Het mice. (H) Het mice responded prematurely significantly less often than WT mice. (I) Short-term memory novel object recognition task graphic. (J) Short-term memory novel object recognition task graph. There were no differences in performance between WT and Het mice at 3-4, 6-7 or 12-13 months. (K) Long-term memory novel object recognition task graphic. (L) Long-term memory novel object recognition task graph. There were no differences in performance between WT and Het mice at 3-4 or 6-7 months. At 12-13 months, Het mice showed a deficit in task performance. (M) T-Maze graphic. (N) T-Maze alternations graph. There were no differences in performance between WT and Het mice at 3-4 or 6-7 months. At 12-13 months, Het mice showed a slight deficit, although this was not significant. (O) T-Maze sequences graph. There were no differences in performance between WT and Het mice at 3-4 or 6-7 months. At 12-13 months, Het mice showed a significant impairment. Two-way repeated measures ANOVA and pairwise comparisons with Greenhouse–Geisser and Bonferroni corrections where appropriate. Data are mean ± SEM.  WT vs Het *p <0.05, **p <0.01, ***p <0.001. (C-H) WT n=7, Het n=6; (J, L, N, O) WT n=10, Het n=10. Wild-type (WT) and heterozygous (Het).
Fig. 3
Fig. 3
Psychiatric tasks in wild-type and heterozygous zQ175 mice. (A) Image of burrowing task with pellets. (B) Burrowing task with pellets. There were no differences detected between WT and Het mice. (C) Image of burrowing task with bedding. (D) Burrowing task with bedding. There were no differences detected between WT and Het mice. (E) Open field. At 3–4 months, WT mice spent more time in the outer zone than the inner zone and Het mice showed a similar phenotype. At 6–7 months, WT mice also spent more time in the outer zone than the inner zone, however Het mice displayed an anxiolytic-like phenotype and did not spend significantly more time in either zone. At 12–13 months, WT mice continued to spend more time in the outer zone than the inner zone, however, as seen at 6–7 months, Het mice displayed an anxiolytic-like phenotype and did not spend significantly more time in either zone. (F) Example heat maps of open field for WT and Het mice at 3–4, 6–7 and 12–13 months. WT mice at 3–4, 6–7 and 12–13 months and Het mice at 3–4 months were tracked round the outside and corners of the arena more, whereas Het mice at 6–7 and 12–13 months were tracked more in the centre of the open field. (G) Speed in open field. There was a difference between WT and Het mice in speed in the open field at 3–4 months, however not at 6–7 or 12–13 months. One-way or two-way ANOVA with Bonferroni correction where appropriate. (B, D, E, G). Data are mean ± SEM. Symbols are square (male) and circle (female). WT vs. Het *p < 0.05, **p < 0.01, ***p < 0.001; All groups n = 10. Wild-type (WT) and heterozygous (Het).
Fig. 4
Fig. 4
Motor tasks in wild-type and heterozygous zQ175 mice. (A) Vertical pole test graphic. (B) Rotarod graphic. (C) Descent latency in vertical pole test. There were no differences between WT vs. Het at 3–4 or 6–7 months. However, Het mice took longer to descend the pole at 12–13 months. (D) Latency to fall from rotarod with accelerating protocol. There were no differences at 3–4 or 6–7 months between WT and Het mice. At 12–13 months there were significant difference between WT and Het mice. (E) Latency to fall from rotarod with fixed speed protocol. At 3–4 or 6–7 months there were no differences between WT and Het mice at 20 rpm, 30 rpm or 40 rpm. At 12–13 months there were differences between WT and Het mice at 20 rpm and 30 rpm but not 40 rpm. One-way ANOVA or two-way repeated measures ANOVA with pairwise comparisons and Greenhouse–Geisser and Bonferroni corrections where appropriate. (C-E) Data are mean ± SEM. Symbols are square (male) and circle (female). WT vs. Het *p < 0.05, **p < 0.01, ***p < 0.001; All groups n = 10. Wild-type (WT), heterozygous (Het) and rotations per minute (rpm).
Fig. 5
Fig. 5
Body weight, brain weight and body composition comparison of wild-type and heterozygous zQ175 mice. (A) Body weight growth curve from 3 to 12 months. There were no differences between WT and Het mice at 3, 4 or 5 months. However, there were significant differences in body weight between WT and Het mice at 6, 7, 8, 9, 10, 11 and 12 months. (B) Brain weights at 12–13 months. Het mice had lower brain weight than WT counterparts. (C) Fat mass (percentage of body weight) at 3–4, 6–7 and 12–13 months. There were no differences at 3–4 or 6–7 months, however, Het mice had significantly lower fat mass than WT mice at 12–13 months. (D) Lean mass (percentage of body weight) at 3–4, 6–7 and 12–13 months. There were no differences at 3–4 or 6–7 months, however, Het mice had higher lean mass than WT mice at 12–13 months. One-way ANOVA or two-way repeated measures ANOVA with pairwise comparisons and Greenhouse–Geisser and Bonferroni corrections where appropriate. (A-D) Data are mean ± SEM. Symbols are square (male) and circle (female). WT vs. Het *p < 0.05, **p < 0.01, ***p < 0.001. (A, C, D) All groups n = 10; (B) WT n = 15, Het n = 12. Wild-type (WT), heterozygous (Het) and grams (g).
Fig. 6
Fig. 6
Huntingtin aggregation pathology in hippocampus, striatum and hypothalamus of wild-type and heterozygous zQ175 mice using mEM48 antibody. (A) Representative images of mutant huntingtin aggregate staining in WT and Het mice aged 3–4, 6–7 and 12–13 months in hippocampus, striatum and hypothalamus. WT mice aged 3–4, 6–7 and 12–13 months do not have positive staining for huntingtin aggregates. Het mice at 3–4 and 6–7 months also have no detectable aggregates. Het mice aged 12–13 months have aggregates in the hippocampus, striatum and hypothalamus. Arrows highlight example aggregates in sections. (B) Average number of aggregates per 0.1mm2 in WT and Het mice aged 3–4, 6–7 and 12–13 months in hippocampus, striatum and hypothalamus. There were no significant differences between WT and Het for hippocampus, striatum, and hypothalamus at 3–4 and 6–7 months. At 12–13 months, significant differences were found between WT and Het for hippocampus, striatum, and hypothalamus. For WT mice, no significant differences were detected for comparisons between any ages or regions. There were also no significant differences in Het mice at 3–4 vs. 6–7 months for hippocampus, striatum, or hypothalamus. There were also no differences between regions in Het mice when compared at 3–4 or 6–7 months. Significant differences were found in Het mice in hippocampus at 3–4 vs. 12–13 months and 6–7 vs. 12–13 months, striatum at 3–4 vs. 12–13 months and 6–7 vs. 12–13 months, and hypothalamus at 3–4 vs. 12–13 months and 6–7 vs. 12–13 months. There were also significant differences in Het mice at 12–13 months when different regions were compared (hippocampus vs. striatum, hippocampus vs. hypothalamus, striatum vs. hypothalamus). (C) Comparison of aggregates per 0.1mm2 in Het mice aged 12–13 months in hippocampus, striatum and hypothalamus. Multiple comparisons as stated above in (B). Striatum showed highest number of aggregates, followed by hippocampus, and hypothalamus with the least. Three-way ANOVA with multiple comparisons and Bonferroni corrections where appropriate. Data are mean ± SEM. *p < 0.05, **p < 0.01, ***p < 0.001. All groups n = 3. Wild-type (WT), heterozygous (Het). Scale bar = 100 μm.
Fig. 7
Fig. 7
Huntingtin aggregation pathology in hippocampal subregions of 12–13-month-old heterozygous zQ175 mice. Representative image of mutant huntingtin aggregate staining in 12–13 month heterozygous mice in (A) Hippocampus proper (B) CA1 region (C) CA2 region (D) CA3 (E) DG suprapyramidal blade (F) DG infrapyramidal blade (G) Comparison of the average number of aggregates per 0.1mm2 in Het mice aged 12–13 months in hippocampal subregions. Notably, the CA2 had very few aggregates and significantly less than all other hippocampal subregions. One-way ANOVA with multiple comparisons and Bonferroni corrections where appropriate. Data are mean ± SEM. *p < 0.05, **p < 0.01, ***p < 0.001. All groups n = 3. Wild-type (WT), heterozygous (Het), Cornu ammonis (CA) and dentate gyrus (DG).
Fig. 8
Fig. 8
Long-term potentiation in 1-month and 3-month-old wild-type and heterozygous zQ175 mice. LTP is impaired in 3-month-old Het mice. (A) Delivery of a 4-TBS caused an initial increase in the slope of the fEPSPs in all mice. The responses of 3 month WT, 1 month WT and 1 month Het stabilize above baseline after 30 min, an effect well maintained at 50–60 min. In 3-month-old Het mice, the initial induction of LTP is reduced compared to 3 month WT. The 3 month Het response gradually decreases to below the 3 month WT response at 50–60 min after 4-TBS. (B) Average % potentiation above baseline observed 50–60 min after 4-TBS. LTP of 3 month Het is significantly impaired compared to 3 month WT. There is no difference in % potentiation between 1 month Het and 1 month WT. One-way ANOVA. Data are mean ± SEM. WT vs. Het *p < 0.05, **p < 0.01, ***p < 0.001. 3 month WT n = 12, 3 month Het n = 15, 1 month WT n = 7, 1 month Het n = 11. Wild-type (WT), heterozygous (Het), long-term potentiation (LTP), 4-pulse theta-burst stimulation (4-TBS) and field excitatory postsynaptic potentials (fEPSPs).

References

    1. MacDonald, M. E. et al. A novel gene containing a trinucleotide repeat that is expanded and unstable on huntington’s disease chromosomes. Cell72 (6), 971–983 (1993). - PubMed
    1. Duyao, M. et al. Trinucleotide repeat length instability and age of onset in huntington’s disease. Nat. Genet.4 (4), 387–392 (1993). - PubMed
    1. Rubinsztein, D. C. et al. Phenotypic characterization of individuals with 30–40 CAG repeats in the huntington disease (HD) gene reveals HD cases with 36 repeats and apparently normal elderly individuals with 36–39 repeats. Am. J. Hum. Genet.59 (1), 16 (1996). - PMC - PubMed
    1. Andrew, S. E. et al. The relationship between trinucleotide (CAG) repeat length and clinical features of huntington’s disease. Nat. Genet.4 (4), 398–403 (1993). - PubMed
    1. Novak, M. J. & Tabrizi, S. J. Huntington’s disease. Bmj. 340, 30 (2010). - PubMed

MeSH terms

LinkOut - more resources