. 2025 Oct;4(10):1345-1362.
doi: 10.1038/s44161-025-00717-y. Epub 2025 Oct 3.

Spatial multiomics of acute myocardial infarction reveals immune cell infiltration through the endocardium

Affiliations

Spatial multiomics of acute myocardial infarction reveals immune cell infiltration through the endocardium

Florian Wünnemann et al. Nat Cardiovasc Res. 2025 Oct.

Abstract

Myocardial infarction (MI) continues to be a leading cause of death worldwide. Even though it is well established that the complex interplay between different cell types determines the overall healing response after MI, the precise changes in the tissue architecture are still poorly understood. In this study, we generated an integrative cellular map of the acute phase after murine MI using a combination of imaging-based transcriptomics (Molecular Cartography) and antibody-based highly multiplexed imaging (Sequential Immunofluorescence). This enabled us to evaluate cell type compositions and changes at subcellular resolution over time. We observed the recruitment of leukocytes to the infarcted heart through the endocardium and performed unbiased spatial proteomic analysis using Deep Visual Proteomics (DVP) to investigate the underlying mechanisms. DVP identified von Willebrand factor (vWF) as an upregulated mediator of inflammation 24 hours after MI, and functional blocking of vWF reduced the infiltration of C-C chemokine receptor 2 (Ccr2)-positive monocytes and worsened cardiac function after MI.


Conflict of interest statement

Competing interests: D.S. reports funding from GlaxoSmithKline and receiving fees/honoraria from ariadne.ai, GlaxoSmithKline, Immunai, Noetik, Alpenglow and Lunaphore. K.B. reports fees from Lunaphore. J.S.R. reports funding from GlaxoSmithKline, Pfizer and Sanofi and fees/honoraria from Travere Therapeutics, Stadapharm, Astex, Owkin, Pfizer and Grunenthal. F.W. is an employee of Seqera. The other authors declare no competing interests.

Figures
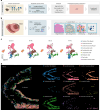
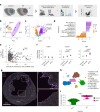
Fig. 1
Fig. 1. Molecular Cartography of acute MI enables spatial cell typing of the left ventricular infarct tissue.
a, Schematic overview of the study design. Two biological replicates chosen across two technical replicate slides were used for Molecular Cartography. Two or three biological replicates were used for SeqIF. b, Schematic for spatial transcriptomics data generation (Molecular Cartography) and processing (nf-core/molkart). c, UMAP showing the joint embedding of 69,028 cells from eight samples (two biological replicates per timepoint) over four timepoints across acute MI. d, Representative spatial cell type distributions for a sample at 2 days after MI. A composite image with all cell types is shown on the left, and each cell type’s individual distribution is shown on the right. Schematics in a and b were created with BioRender.com. d, days; h, hours; LV, left ventricular. Source data
Fig. 2
Fig. 2. Spatial analysis of Molecular Cartography cell composition during MI highlights myeloid interactions with the endocardial layer.
a, Spatial cell type relationships in cardiac control tissue as calculated by MISTy. Importance indicates spatial interactions across the slide between the two cell types highlighted. For all MISTy analyses, only interactions with an importance >0.4 and only cell types with a gain in R2 > 5% are shown. R2 represents the change of variance when including the spatial context (paraview, radius = 125 µm). b,c, Local bivariate analysis between endocardial cells and cardiomyocytes Nppa+ (b) and endocardial cells and myeloid cells (c), respectively. Color indicates the local product as calculated by LIANA+. d, RNA spot localization in an endocardial region of control tissue, highlighting spatial co-localization of marker genes for endothelial/endocardial cells (Pecam1), cardiomyocytes (Pln and Nppa), fibroblasts (Pdgfra and Col1a1) and myeloid cells (Cd74, Lyz2 and C1qa). e, MISTy analysis for left ventricular tissue 2 days after MI shows an interaction between endocardial cells and myeloid cells. f,g, Local interaction analysis shows the interaction of endocardial cells with cardiomyocytes Nppa+ (f) and myeloid cells (g) in the endocardial infarct zone. h, RNA marker expression confirming localized expression of myeloid markers in the endocardial infarct zone. i, MISTy analysis for 4 days after MI highlights the spatial relationship between cardiac fibroblast and myeloid cells around the infarct core. j,k, Local interaction analysis shows the interaction of myeloid cells with cardiomyocytes Nppa+ (j) and cardiac fibroblasts (k). l, RNA spot localization within the infarct tissue at 4 days after MI. m, Euclidean distances between all pairs of cell types were calculated. Euclidean distances between all pairs of cell types were calculated and the distance to the closest myeloid cell was used for endocardial cells and cardiac fibroblasts. n, Euclidean distances between endocardial cells to myeloid cells were significantly different across the first 4 days after MI (n = 2 biological replicates for all groups, type II ANOVA P = 0.0095). Post hoc analysis showed significant differences at 2 days (post hoc t-test with Bonferroni correction, P = 0.022 after MI relative to control but no difference between 2 days and 4 days (P = 0.084)). o, Euclidean distances between cardiac fibroblasts and myeloid cells were significantly reduced at 4 days after MI (n = 2, same biological samples as in n, post hoc t-test with Bonferroni correction, P = 0.038). Bars represent mean distance in micrometers, and points represent individual measurements. d, days. Source data
Fig. 3
Fig. 3. Highly multiplexed imaging using SeqIF and conventional immunofluorescence during the first 2 days of acute MI confirms infiltration of myeloid cells via the endocardial layer.
a, Schema of experimental design for SeqIF data generation and processing. For SeqIF, three biological replicates were sampled for controls and two biological replicates for the remaining timepoints. All SeqIF replicates were different mice than those used for Molecular Cartography experiments. b, Representative SeqIF of mouse heart cross-sections using 10 antibodies before (left) and at 24 hours after (right) MI. Magnifications on the right highlight endocardial niches in the infarct, characterized by the presence of stressed cardiomyocytes (Ankrd1+, orange) and attachment of immune cells to endocardial cells (CCR2+ in green, Mpo+ in violet and CD31 in yellow). ROIs, 50 µm. c, Cell phenotyping heatmap from Pixie highlighting marker expression in different cell masks across the entire dataset. Legend represents the scaled marker expression, which was capped at 3. d, Pixie cell phenotyping for one representative sample per timepoint. Each pixel is colored based on its cell pixel cluster as calculated by Pixie. Cell type colors correspond to heatmap grouping colors in c. e, Distances in micrometers from endocardial cells to the closest myeloid cell quantified at four different timepoints from SeqIF images. Distances show a significant change across the measured timepoint (n = 2 biological replicates for all timepoints, type II ANOVA P = 0.0279). Bars show mean distances across biological replicates, and points represent mean distances per biological replicate. f, Schema of anatomical annotations used to calculate myeloid cell infiltration. g, Quantifications of Ccr2+CD68+ Mo/Mɸ in different spatial regions in cross-sections from SeqIF. Relative cell type abundance is visualized as cells per mm2. Bars show mean abundance, and points represent individual measurements from biological replicates (n = 2 for each timepoint). Schematics in a and f were created with BioRender.com. CM, cardiomyocyte; d, days; EC, endothelial cell; FB, fibroblast; h, hours; Leuko, leukocyte; SMC, smooth muscle cell. Source data
Fig. 4
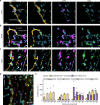
Fig. 4. Mo/Mɸ infiltrate the infarcted heart via the endocardium.
ac, Representative SeqIF stainings showing selected markers, including CD31 (yellow), CCR2 (magenta), CD68 (green) and DAPI (blue). Staining of sections 4 hours (a), 24 hours (b) and 2 days (c) after MI indicates increased attachment (asterisk) and transmigration (arrow), resulting in high density of CCR2+CD68+ cells in the (sub)endocardial infarct zone and movement of CCR2+ cells toward the infarct core. Mid and right panels represent magnifications of the marked box in the left overview panel. d, days; h, hours; LV, left ventricular.
Fig. 5
Fig. 5. Laser capture microdissection coupled to ultrasensitive proteomics at 1 day after MI reveals local vWF upregulation in endocardial cells.
a, Schema for experimental design comparing endocardium of control (green), infarct zone (IZ, purple) and remote regions (orange). b, PCA of the three indicated experimental groups (n = 3–4 biological replicates). c, Volcano plot of the proteomic differential comparison between infarct endocardium and remote endocardium. Significantly differentially expressed proteins are displayed in purple (upregulated in infarct endocardium) and orange (downregulated in infarct endocardium). Differential expression was assessed by an empirical Bayes moderated t-test (limma-voom). d, Pathway enrichment analysis results using hallmark gene sets of DEPs between MI IZ and MI remote. e, Endocardial cell specificity analysis of DEPs between MI IZ and MI remote. The x axis shows specificity of gene expression (as approximated by differential marker gene expression) based on snRNA-seq data from Calcagno et al., whereas the y axis shows log2FC from differential protein expression analysis shown in c. f, Expression plots of three proteins of interest based on ultrasensitive proteomics. Cdh11 is a marker for endocardial cells and not differentially expressed, whereas Vcam1 and vWF show significant differential expression during acute MI (n = 3 for control and n = 4 for MI remote and MI IZ groups; P values shown are from differential expression assessed by an empirical Bayes moderated t-test (limma-voom)). Line represents mean expression, and points represent individual measurements. g, Representative conventional immunofluorescence staining of vWF (magenta) alongside CD31 (yellow) 24 hours after murine MI. h, UMAP of human cardiac cell types identified in snRNA-seq data from Amrute et al.. Endocardial cell cluster used for differential gene expression analysis is highlighted with a dotted circle. i, Violin plot of normalized RNA expression from snRNA-seq data aggregated to pseudobulk for all donor samples (n = 6) and acute MI samples (n = 4) from Amrute et al., with significant upregulation of vWF in human endocardial cells of acute MI samples (DESeq2 analysis on pseudobulk expression values; P = 1.4 × 10−5). Schematic in a was created with BioRender.com. AMI, acute MI; FC, fold change; NK, natural killer; PC, principal component; Pval, P value. Source data
Fig. 6
Fig. 6. Blockade of vWF results in decreased Mo/Mɸ recruitment and impaired infarct healing.
a, Representative immunofluorescence staining of vWF, CCR2, CD31 and DAPI 24 hours after MI. b, Correlation of CCR2+ cells and mean fluorescence intensity (MFI) of vWF within the endocardial infarct area. A total of 164 annotations of similar size were added across the endocardium to assess vWF MFI and the presence of CCR2+ cells within each annotation (n = 3 samples; dashed lines indicate 95% confidence intervals). R represents the correlation coefficient. c, Schema of the experimental setup for functional vWF blocking during acute MI. d, Quantitative analysis of cardiac Mo/Mɸ 2 days after MI based on conventional immunofluorescence in different regions (BZ, border zone; core, infarct core; endo, endocardial IZ; epi, epicardial IZ). Boxes represent mean ± s.d. (n = 3 samples per group). P values were determined by two-way ANOVA followed by Sidakʼs multiple comparison. e, Representative immunofluorescence stainings of CCR2+ cells (green) after both IgG and anti-vWF treatment 2 days after MI in the endocardial IZ. f, Representative B-mode images 14 days after MI induction. Green lines depict left ventricular endocardial displacement. gj, Global longitudinal strain (g), left ventricular ejection fraction (h) and end-systolic (i) and end-diastolic volume (j) determined by echocardiography 14 days after MI induction. k, Heart weight (HW) to body weight (BW) ratios after organ removal 14 days after MI. l, Quantification of infarct thickness based on histopathological evaluation 14 days after MI. Data show mean ± s.d.; points display individual measurements (n = 8 samples per group). P values were calculated using two-tailed Studentʼs t-test. m, Representative images of Masson trichrome stainings of both IgG-treated and anti-vWF-treated mice 14 days after infarction. h, hours; IF, immunofluorescence; LV, left ventricular. Source data
Extended Data Fig. 1
Extended Data Fig. 1. Region of interest (ROI) selection and spot distribution of mouse heart sections from Molecular Cartography.
a) Brightfield images of transverse sections of mouse hearts at different time points during acute MI (Control = prior to infarct). Black rectangles highlight regions selected for Molecular Cartography. b) Molecular Cartography RNA spots (100-plex) for corresponding regions highlighted in a). Regions with low spot density within the tissue at the 4 h, 2 d and 4 d post-MI timepoints demarcate infarct regions with cell death, apoptosis and RNA degradation. Note that images in b) show scatterplots of RNA spot centroid positions after spot calling by Resolve Bioscience and not the raw FISH signals. c) Exemplar regions of RNA expression maps of indicated markers over all 4 timepoints.
Extended Data Fig. 2
Extended Data Fig. 2. Comparison of segmentation methods for Molecular Cartography and SeqIF heart sections.
a) Example evaluation on a single image of 4 segmentation models across 8 panels: ground truth (blue) and prediction (yellow) panels show all ground truth (GT) and predicted cells, respectively. True positives show GT regions in blue, prediction regions in yellow, and their overlaps in green. False negative panels show unmatched GT cells, and false positive panels show unmatched predicted cells. Merges, splits, and catastrophe panels show GT cells (blue), predictions (yellow), and their overlaps (green). b) Heatmap showing counts of true positives, false positives, false negatives, merges, splits, and catastrophes across the 4 segmentation models evaluated on independently annotated GT from 16 image crops (4 per time point) in the SeqIF dataset (total: 1208 cells). c) Segmentation evaluation metrics based on the GT annotations calculated on means of image-specific metrics, with error bars showing the standard deviation across images. d) Percentage of transcripts assigned to cells (Molecular Cartography) and percentage of segmented tissue area (SeqIF). Data show mean ± s.d. Source data
Extended Data Fig. 3
Extended Data Fig. 3. Spatial cell type distribution and composition changes during acute MI as quantified by Molecular Cartography.
a) Spatial distribution of cell-types in Molecular Cartography samples at four time points each with two biological replicates. b) Cell-type composition across acute myocardial infarction as quantified by Molecular Cartography. Barplots show mean percentage, points represent individual replicate measurements. c) Dotplot showing marker expression for identified immune cell subtypes. Immune subtype names are followed by their distinguishing marker with an underscore. d) Spatial distribution of these immune cell subtypes in two biological replicates for 4 h and 2 days. Source data
Extended Data Fig. 4
Extended Data Fig. 4. SeqIF pixel clusters and cell phenotypes across acute MI time series.
a) Pixel phenotype map for mouse heart images produced with SeqIF during a time course of acute myocardial infarction. Pixels were clustered using self-organizing maps leveraging Pixie and colored according to their assigned pixel cluster. A total of 9 different pixel clusters were classified. b) Heatmap of quantified marker expression in the corresponding pixel phenotype clusters. Colors for pixel clusters correspond to visualization in a. c) Quantification of pixel phenotypes across acute MI reveals strong reduction in Tnnt2+ pixels, increase in Ankrd1+ pixels and an increase in pixel clusters for myeloid cells (CD45+, Mpo+, Ccr2+, Trem2+, CD68+) during the first four days post MI. Colors correspond to pixel phenotypes visualization in a. Bars represent mean values from two biological replicates and points represent individual measurements. d) Zoom-ins for endocardial infarct zone regions from SeqIF images with corresponding cell typing highlighted. Top row shows SeqIF images with stainings for DNA (Hoechst = cyan), Cd31 (orange), Ccr2 (green) and Mpo (pink) at 3 different time points (4 h, 24 h and 48 h). Bottom row shows corresponding cell segmentations and cell types with endothelial cells (orange), Ccr2+ monocytes / macrophages (green) and neutrophils (pink). All other cell types are marked in grey for visualisation purposes. Source data
Extended Data Fig. 5
Extended Data Fig. 5. Quantification of immune cell infiltration based on conventional IF imaging.
a) Schematic highlighting different regions for quantification of immune cell infiltration. Absolute (b) and relative (c) numbers of CCR2 + /CD68+ Mo/Mɸ in different regions of the heart as depicted in a, using conventional immunofluorescence staining for CCR2, CD68, CD31, WGA and DAPI. Bars show mean abundance and points represent individual measurements. P values were determined by 2-way ANOVA followed by Tukey’s multiple-comparison test. Only significant comparisons between timepoints within each region are displayed. *P < 0.05 vs. pre, #P < 0.05 vs. 4 h, §P < 0.05 vs. 24 h. Source data
Extended Data Fig. 6
Extended Data Fig. 6. SeqIF staining of infiltrating Mo/Mɸ in the endocardial layer after MI and quantification of Mo/Mɸ and CD31+ cells of the vasculature from SeqIF data using a binning strategy.
a–c) Representative SeqIF images showing selected markers including CD31 (yellow), CCR2 (magenta), CD68 (green) and DAPI (blue) with attachment (asterisk) and transmigration (arrow) of CCR2 + CD68+ monocytes/macrophages. d) The endocardial infarct zone in SeqIF images was split into bins from lumen towards the infarct core to quantify cells across the bins over time. Cyan: DAPI, yellow: Cd31, magenta: Ccr2, cyan square: endocardial cells, yellow circle: other endothelial cells, magenta triangle: Ccr2+ Mo/Mɸ. e) Relative cell abundance in mm2 across different endocardial infarct zone bins from SeqIF shows an increase of Ccr2+ Mo/Mɸ at the endocardial layer around 24 h, while abundance Cd31+ cells of the vasculature remains constant over time. Source data
Extended Data Fig. 7
Extended Data Fig. 7. Immunofluorescent staining of CCR2+ Mo/Mɸ and endocardial vWF after MI and ischemia/reperfusion injury.
a, b) Quantification of vWF in different regions 24 h after MI based on immunofluorescence in female and male mice. c) Immunofluorescence stainings of CCR2 and vWF in the infarct zone 24 h after ischemia/reperfusion injury. d) Quantification of endocardial vWF after ischemia/reperfusion injury. e) Quantification of infiltrating Mo/Mɸ at the endocardial region in both control hearts and hearts after ischemia/reperfusion injury. Source data

References

    1. Yan, X. et al. Temporal dynamics of cardiac immune cell accumulation following acute myocardial infarction. J. Mol. Cell. Cardiol.62, 24–35 (2013). - PubMed
    1. Khan, M. A. B. et al. Global epidemiology of ischemic heart disease: results from the Global Burden of Disease study. Cureus12, 9349 (2020). - PMC - PubMed
    1. Laforgia, P. L., Auguadro, C., Bronzato, S. & Durante, A. The reduction of mortality in acute myocardial infarction: from bed rest to future directions. Int. J. Prev. Med.13, 56 (2022). - PMC - PubMed
    1. Asaria, P. et al. Acute myocardial infarction hospital admissions and deaths in England: a national follow-back and follow-forward record-linkage study. Lancet Public Health.2, e191–e201 (2017). - PMC - PubMed
    1. Kochar, A. et al. Long‐term mortality of older patients with acute myocardial infarction treated in US clinical practice. J. Am. Heart Assoc.7, e007230 (2018). - PMC - PubMed

MeSH terms