. 2025 Oct 3;25(1):1303.
doi: 10.1186/s12870-025-07372-2.

Multi-omics analyses reveal the defense mechanisms behind the tolerance of the 'Parson Brown' sweet orange to Huanglongbing

Affiliations

Multi-omics analyses reveal the defense mechanisms behind the tolerance of the 'Parson Brown' sweet orange to Huanglongbing

Lamiaa M Mahmoud et al. BMC Plant Biol. .

Abstract

Background: 'Parson Brown' sweet orange is an early-maturing variety and is considered a resilient tree in the face of Huanglongbing (Citrus Greening) disease. Its ability to maintain productivity under endemic HLB conditions has demonstrated its value for growers battling this devastating disease. This study compared the metabolomic profile, transcriptomic analysis, and physiological responses of three early-maturing sweet oranges: 'Hamlin', 'Roble', and 'Parson Brown'.

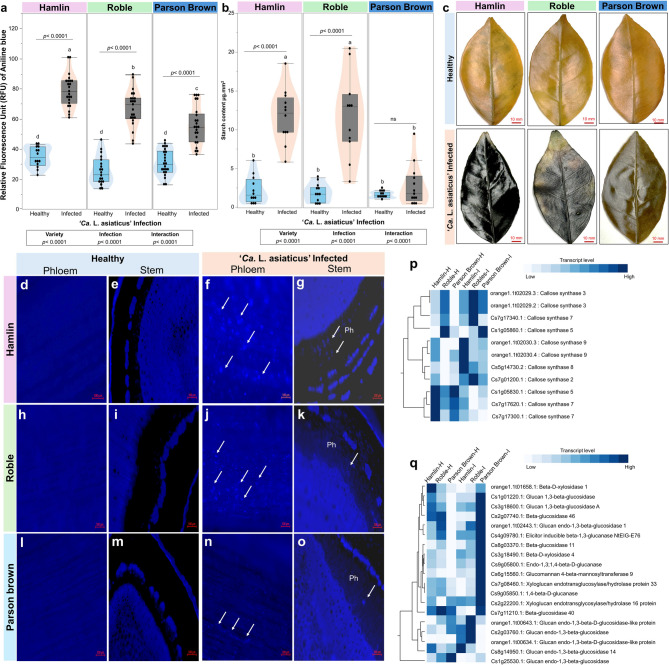
Results: Healthy greenhouse-grown trees were propagated and exposed to 'Candidatus Liberibacter asiaticus' via psyllid infestation. We recorded a decrease of landed psyllids on 'Parson Brown' (20.58%) compared to 'Hamlin' (34.38%) and 'Roble' (45.04%), in addition to a lower 'Ca. L. asiaticus' titer in 'Parson Brown'. Transcriptomic profiling indicated cultivar-specific expression patterns, with 'Parson Brown' showing strong upregulation of genes involved in terpenoid and flavonoid biosynthesis. Infected 'Parson Brown' trees exhibited significantly higher total phenolic and flavonoid contents, lower ROS and H₂O₂ levels, and enhanced expression of antioxidant-related genes. Volatile analysis revealed distinct profiles in 'Parson Brown', including elevated levels of certain monoterpenes, which may contribute to reduced vector attraction.

Conclusion: The tolerance of 'Parson Brown' is driven by a multifaceted defense response, emphasizing the value of traditional breeding in combining diverse resistance traits from parental lines.

Keywords: Citrus greening; Disease tolerance; Huanglongbing; Metabolomics; Sweet orange; Terpene biosynthesis; Transcriptomics.


Conflict of interest statement

Declarations. Ethics approval and consent to participate: Not applicable. Consent for publication: Not applicable. Competing interests: The authors declare no competing interests.

Figures

Fig. 1
Fig. 1
a Bar chart depicting the ratio of Asian citrus psyllid (ACP) landing on the three varieties from seven independent experiments and pie chart illustrating the percentage of ACP landing and settling on ‘Hamlin,’ ‘Roble’, and ‘Parson Brown’ (n = 8). b Quantitative PCR (qPCR) analysis showing cultivar-specific differences in ‘Ca. L. asiaticus’ titer (Ct) 6 and 12 months post-ACP feeding. Data are presented as mean ± standard deviation, n = 4. The statistical significance was established at p < 0.05
Fig. 2
Fig. 2
Differentially expressed genes (DEGs) and their functional enrichment across three sweet orange varieties (‘Hamlin’, ‘Parson Brown’, and ‘Roble’) under controlled conditions compared to the infected trees. Panels a, b, and c show a volcano plot and the number of DEGs in the comparisons. Panels d, e, and f illustrate gene set enrichment (GSE) analysis
Fig. 3
Fig. 3
Differentially expressed genes (DEGs) and their functional enrichment across three sweet orange varieties (‘Hamlin’, ‘Parson Brown’, and ‘Roble’) following ‘Ca. L. asiaticus’ -infection compared to each other. Panels a, b, and c show volcano plot and the number of DEGs in the comparisons. Panels d, e, and f illustrate gene set enrichment (GSE) analysis
Fig. 4
Fig. 4
Overview of metabolite content and phytohormone-related gene expression profiles in sweet orange varieties under healthy and infected conditions. a Total Phenolic Content (TPC) and b Total Flavonoid Content (TFC) in Sweet Orange varieties under Healthy and Infected Conditions. Boxplots show the interquartile ranges (25th to 75th percentiles of the data), and black dots represent the raw data (n = 30). Two-way ANOVA was performed to assess the effects of variety, treatment (healthy vs. infected), and their interaction. Additionally, paired t-tests were conducted to compare healthy and infected samples within each variety. Significant differences between groups are indicated by different letters; groups that share any letter are not significantly different (p < 0.05). c Gene expression profiles of metabolite- and phytohormone-related genes. One-way hierarchical cluster analysis (HCA) with heatmaps was performed using transcript levels of genes involved in metabolite biosynthesis and phytohormone signaling pathways. The cells represent the reads of each gene (n = 3)
Fig. 5
Fig. 5
Antioxidant Activity and Gene Expression Profiles in Sweet Orange Cultivars under Infection. a DPPH scavenging capacity (%). b Hydrogen peroxide (H2O2) levels (µM·mg−1). c In situ histochemical analysis of H2O2 using DAB staining. c In situ histochemical detection of hydrogen peroxide (H₂O₂) localization using DAB staining in citrus leaves. The red arrows are pointing to areas of brown precipitate, which indicates the presence of hydrogen peroxide (H₂O₂). d ROS production levels as indicated by H2DCFDA staining. e In situ staining for superoxide anion (O2•−) using NBT. The white arrows are pointing to areas of ROS fluorescence. Boxplots show the interquartile ranges (25th to 75th percentiles of the data), and black dots represent the raw data (n = 30). Two-way ANOVA was performed to assess the effects of variety, treatment (healthy vs. infected), and their interaction. Additionally, paired t-tests were conducted to compare healthy and infected samples within each variety. Significant differences between groups are indicated by different letters; groups that share any letter are not significantly different (p < 0.05). Two-way hierarchical cluster analysis and heatmap of the glutathione S-transferase-like proteins f, Thioredoxin-like protein-related genes g, and peroxidase genes h. Two-way hierarchical cluster analysis (HCA) with heatmaps was performed using transcript levels of genes involved in antioxidant-related genes. The cells represent the reads of each gene (n = 3)
Fig. 6
Fig. 6
Volatile organic compounds (VOCs) detected from sweet orange variety leaves under healthy and ‘Ca. L. asiaticus’- infection. a, b Principal component analysis (PCA) shows the multivariate variation among the VOCs released from the leaves of the two conditions. a PCA scatter plot. b PCA loading plot. Colored symbols correspond to the VOCs released from the treatments for the three varieties, both healthy and infected. c one-way hierarchical cluster analysis and heatmap of the VOCs released from the three varieties. Rows represent compounds, and columns represent the two treatments for the three varieties. The cells represent the mean peak area of each compound (n = 5). d One-way hierarchical cluster analysis and heatmap of the terpene-related DEGs expressed in the three varieties. The cells represent the reads of each gene (n = 3)
Fig. 7
Fig. 7
Callose accumulation, starch content, and gene expression in sweet orange variety leaves under healthy and ‘Ca. L. asiaticus’-infection. a Relative Fluorescence Unit (RFU) values from aniline blue staining of callose plugs in the stem phloem of ‘Hamlin,’ ‘Roble,’ and ‘Parson Brown.’ b Endogenous starch levels (µg·mg−1). Boxplots show the interquartile ranges (25th to 75th percentiles of the data), and white dots represent the raw data (n = 30). Two-way ANOVA was performed to assess the effects of variety, treatment (healthy vs. infected), and their interaction. Additionally, paired t-tests were conducted to compare healthy and infected samples within each variety. Different letters indicate statistically significant differences (p < 0.05). c In situ iodine staining images of starch accumulation. d, h, i callose staining using aniline blue of phloem tissues for the three varieties under control conditions, f, j, n callose staining of phloem tissues under ‘Ca. L. asiaticus’- infection. e, j, m callose staining of stem tissues for the three varieties under control conditions, g, k, o callose staining of stem tissues under ‘Ca. L. asiaticus’- infection. The white arrows are pointing to areas of callose deposition. p One-way hierarchical cluster analysis and heatmap of expression analysis of callose synthase genes, and q glucosidase-related genes. The cells represent the reads of each gene (n = 3)
Fig. 8
Fig. 8
Metabolite Profiling of Healthy and ‘Ca. L. asiaticus’ -Infected sweet orange trees ‘Hamlin’, ‘Roble’, and ‘Parson Brown’. a, b Principal component analysis (PCA) shows the multivariate variation among the metabolites accumulated in the leaves of the two conditions. a PCA scatter plot. b PCA loading plot. Colored symbols correspond to the metabolites in the three varieties, both healthy and infected. c-h Percentage composition of metabolite groups in the leaves of healthy and infected sweet orange varieties (‘Hamlin’, ‘Parson Brown’, and ‘Roble’)

References

    1. Talon M, Gmitter FG Jr. Citrus genomics. Int J Plant Genomics. 2008;2008(1):528361. - PMC - PubMed
    1. Bové JM. Huanglongbing: a destructive, newly-emerging, century-old disease of citrus. J Plant Pathol. 2006;88:7–37.
    1. Wang N, Trivedi P. Citrus huanglongbing: a newly relevant disease presents unprecedented challenges. Phytopathology. 2013;103(7):652–65. - PubMed
    1. Stover E, McCollum GT, Driggers R, Lee R, Shatters R Jr, Duan Y, Ritenour M, Chaparro JX, Hall DG. Resistance and tolerance to Huanglongbing in citrus. Acta Hortic. 2015;1065:899–903.
    1. USDA. Florida Orange Production Plummeted for Years. Citrus Industry. 2024.

LinkOut - more resources