. 2025 Sep 18:5:1644695.
doi: 10.3389/fbinf.2025.1644695. eCollection 2025.

BC-predict: mining of signal biomarkers and production of models for early-stage breast cancer subtyping and prognosis

Affiliations

BC-predict: mining of signal biomarkers and production of models for early-stage breast cancer subtyping and prognosis

Sangeetha Muthamilselvan et al. Front Bioinform. .

Abstract

Introduction: Disease heterogeneity is the hallmark of breast cancer, which is the most common female malignancy. With a disturbing increase in mortality and disease burden, there remains a need for effective early-stage theragnostic and prognostic biomarkers. In this work, we improved on BrcaDx (https://apalania.shinyapps.io/brcadx/) for cancer vs control screening and examined a cluster of adjoining learning problems in breast cancer heterogeneity: (i) identification of metastatic cancers; (ii) molecular subtyping (TNBC, HER2, or luminal); and (iii) histological subtyping (invasive ductal or invasive lobular).

Methods: We analyzed the transcriptomic profiles of breast cancer patients from public-domain databases such as the TCGA using stage-encoded problem-specific statistical models of gene expression and unveiled stage-salient and progression-significant genes. Using a consensus approach, we identified potential machine learning features, and considered six model classes for each learning problem, with hyperparameter optimization on a training dataset and evaluation on a holdout test dataset. A nested approach enabled us to identify the best model class for each learning problem.

Results: External validation of the best models yielded balanced accuracies of 97.42% for cancer vs normal; 88.22% for metastatic v/s non metastatic; 88.79% for ternary molecular subtyping; and ensemble accuracy of 94.23% for histological subtyping. The model for molecular subtyping was validated on a 26-sample TNBC-only out-of-distribution cohort, yielding 25 correct predictions. We performed a late integration of multi-omics datasets by validating the feature space used in each problem with miRNA profiles, methylation profiles, and commercial breast cancer panels.

Discussion: Pending prospective studies, we have translated the models into BC-Predict that forks the best models developed for each problem in a unified interface and provides a complete readout for input instances of expression data, including uncertainty estimates. BC-Predict is freely available for non-commercial purposes at: https://apalania.shinyapps.io/BC-Predict.

Keywords: biomarker signature discovery; breast cancer heterogeneity; explainable AI; integrative multi-omics; machine learning; metastatic disease; molecular and histological subtype; stage-specific differential gene expression.


Conflict of interest statement

The authors declare that the research was conducted in the absence of any commercial or financial relationships that could be construed as a potential conflict of interest.

Figures
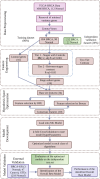
FIGURE 1
FIGURE 1
ML model development for Cancer vs. Normal binary classification. Data-driven optimization of a multi-phase workflow, including nested model selection, is shown. Hypothesis space pruning is achieved via feature selection techniques, leading to a consensus gene-signature. Six different classes of machine learning algorithms were considered, with hyperparameter optimization via k-fold cross-validation on the training dataset and model class selection on the holdout test dataset. External validation of the best model yielded a robust assessment of generalizability. Problem-specific substitutions yield workflows adapted to the other problems considered.
FIGURE 2
FIGURE 2
Design of BC-Predict. A schematic of a cascade model for early-stage breast cancer subtyping and prognosis is presented. If the sample is predicted as ‘cancer’ in the first level, it is passed through three more models in the second level that holistically characterize the cancer sample toward personalized medicine.
FIGURE 3
FIGURE 3
Mining of candidate biomarkers. (A) Volcano plot of statistical significance vs log-fold change of differentially expressed genes. Downregulated genes (log-fold change <2) are shown as blue dots, whereas upregulated genes (log-fold change >2) are shown as red dots. Stage-salient genes are highlighted. (B) Top two principal components of the expression matrix of the top ten genes from linear modelling. Normal samples can be seen to orient away from cancer samples. (C) UpSet plot of the stage-specific contrast analysis illustrating the shared counts of DEGs. (D) Heatmap representation of the stagewise expression of the 24 stage-salient genes, with both sample and gene dendrograms. It is seen that the gene dendrogram exhibits two main clusters, corresponding to overexpressed genes (red) and downregulated genes (blue). Euclidean distance metric was used for hierarchical clustering.
FIGURE 4
FIGURE 4
Distribution of expression of the top-ranked genes in linear model sorted by sample stage, to illustrate differential expression patterns. It is seen that (a) NEK2 (rank#1), (b) MMP11 (rank#2), and (c) PKMY11 (rank#3) in the top row are overexpressed in cancers, whereas (d) GPAM (rank#4) and (e) HSD17B13 (rank#11) in the bottom row are downregulated in cancers. A variability in expression levels of each gene across stages is also seen. The expression violins of all the top 200 genes from the linear model are presented in Supplementary File S3.
FIGURE 5
FIGURE 5
Importance ranking of features used in developing the molecular subtype model. The scores are normalized with respect to the top-scoring feature, GATA3, and presented in the sorted order.
FIGURE 6
FIGURE 6
Mixture model of methylation densities, and scatter of expression vs methylation for the respective cluster of each stage-salient differential methylation-driven gene. (a) FOXA1 (b) AKR7A3 (c) COX7A1 (d) DEGS2 and (e) EGR1. Density plots include mixture components in orange, green, and purple, two for each of FOXA1, AKR7A3, DEGS2, and EGR1, and three for COX7A1. Bayesian Information Criterion was used for estimating the number of mixture components. Scatter plots revealed a consistent negative correlation between DNA methylation and gene expression, marked by different colors for mixture components. Visualized using MethylMix.

References

    1. Agarwal V., Bell G. W., Nam J.-W., Bartel D. P. (2015). Predicting effective microRNA target sites in mammalian mRNAs. eLife 4, e05005. 10.7554/elife.05005 - DOI - PMC - PubMed
    1. Ali R., Wendt M. K. (2017). The paradoxical functions of EGFR during breast cancer progression. Signal Transduct. Target. Ther. 2, 16042-. 10.1038/sigtrans.2016.42 - DOI - PMC - PubMed
    1. Allain D. C. (2008). Genetic counseling and testing for common Hereditary breast cancer syndromes. J. Mol. Diagn. JMD 10, 383–395. 10.2353/jmoldx.2008.070161 - DOI - PMC - PubMed
    1. Almstedt K., Mendoza S., Otto M., Battista M. J., Steetskamp J., Heimes A. S., et al. (2020). EndoPredict® in early hormone receptor-positive, HER2-negative breast cancer. Breast Cancer Res. Treat. 182, 137–146. 10.1007/s10549-020-05688-1 - DOI - PMC - PubMed
    1. Arora A., Agarwal D., Abdel‐Fatah T. M., Lu H., Croteau D. L., Moseley P., et al. (2016). RECQL4 helicase has oncogenic potential in sporadic breast cancers. J. Pathol. 238, 495–501. 10.1002/path.4681 - DOI - PMC - PubMed

LinkOut - more resources