

How do visual and smartphone camera-based shoulder ranges of motion compare?
- PMID: 41049664
- PMCID: PMC12490633
- DOI: 10.1016/j.jseint.2025.05.026
How do visual and smartphone camera-based shoulder ranges of motion compare?
Abstract
Background: Objective assessment of functional shoulder range of motion (ROM) is crucial for evaluating shoulder interventions and guiding rehabilitation. The goniometer is the clinical standard, but due to practicality, visual estimation is often used despite its lower reliability. Recently, smartphone video-based assessment using two-dimensional (2D) pose estimation models has emerged as a potential objective alternative. This study aimed to compare 2D-pose-based ROM assessment with visual estimation and examine inter-observer agreement.
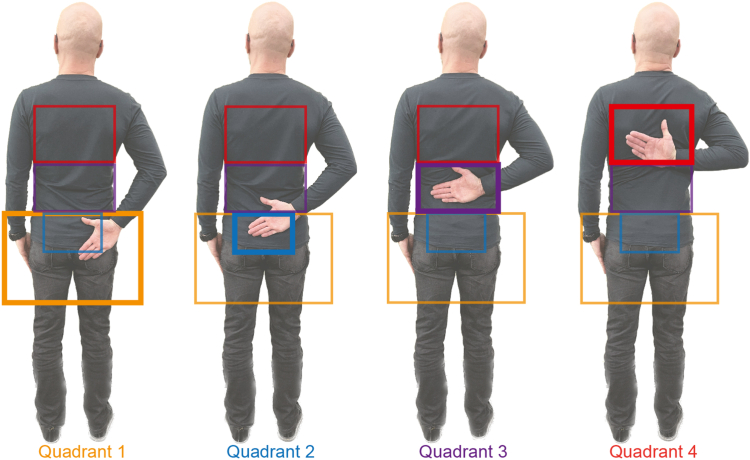
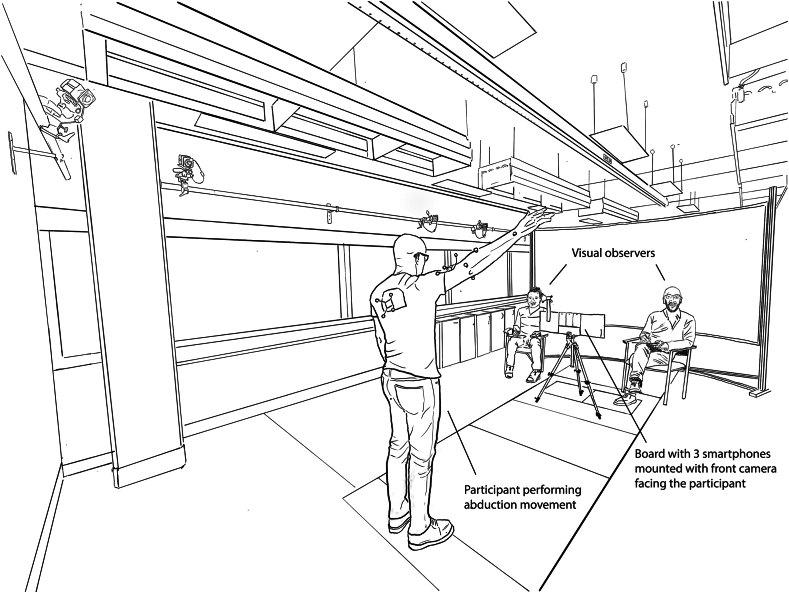
Methods: Seventeen individuals (8 females, 9 males) with normal, pain-free shoulder function were assessed for active ROM in abduction, flexion, extension, external rotation (ER) in two positions (ERI & ERII), and functional internal rotation (FIR). 2D videos from three smartphones were used to estimate shoulder ROM, while two othopedic surgeons visually estimated ROM. For each movement, participants performed six repetitions, three at maximum and three less than maximum ROM (self-selected). Mixed effects models assessed the relationship between 2D-pose-based and visual-based ROM, with visual observer as fixed factor and visual estimates × observer interaction. The coefficient of determination (R2) from these mixed effects models assessed consistency, and smallest detectable difference was used to determine agreement.
Results: Consistency between 2D-pose and visual estimates was excellent for abduction (R2 = 0.99), flexion (R2 = 0.95), and ERII (R2 = 0.86), good for extension (R2 = 0.69) and ERI (R2 = 0.73), and fair for FIR (R2 = 0.52). Smallest detectable difference values ranged from 4.4° to 7.9°. Agreement varied by movement type and observer, with significant visual estimates × observer (P < .003) interaction effects for abduction and flexion: both observers reported higher ROM values than 2D-pose near end-ROM (∼3-4°) with observer 2 reporting lower values than observer 1 (∼15°) at smaller ROM (<60°). 2D-pose estimates were higher (∼20°) for extension at low ROM (<45°) than visual estimates. 2D-pose estimates were lower (∼30°) for ERI at high ROM (>45°) than visual estimates. Visual observers agreed on extension, ERI, ERII, and FIR estimates but disagreed on abduction and flexion estimates.
Conclusion: 2D-pose-based estimates of shoulder ROM were consistent with visual estimates for most movements, though discrepancies existed at specific ROM levels and between observers. The higher resolution estimates of 2D-pose suggests it could reduce observer variation, making it a promising alternative for clinical and research settings. However, further refinement is needed for movements like ERI and FIR using both methods. These findings highlight the importance of method consistency in assessing shoulder ROM and the potential benefits of automated methods for more consistent evaluations.
Keywords: Pose estimation; Range of motion assessment; Shoulder; Smartphone; Thoracohumeral; Validity.
© 2025 The Authors.
Figures


References
-
- Apple . 2022. Detecting human body poses in images. Apple Inc: Cupertino, CA.
-
- Beshara P., Davidson I., Pelletier M., Walsh W.R. The intra- and inter-rater reliability of a variety of testing methods to measure shoulder range of motion, hand-behind-back and external rotation strength in healthy participants. Int J Environ Res Public Health. 2022;19 doi: 10.3390/ijerph192114442. - DOI - PMC - PubMed
-
- Cicchetti D.V. Guidelines, criteria, and rules of thumb for evaluating normed and standardized assessment instruments in psychology. Psychol Assess. 1994;6:284–290.
-
- Conboy V.B., Morris R.W., Kiss J., Carr A.J. An evaluation of the Constant-Murley shoulder assessment. J Bone Joint Surg Br. 1996;78:229–232. - PubMed