. 2025 Sep 10;28(10):113537.
doi: 10.1016/j.isci.2025.113537. eCollection 2025 Oct 17.

An interleukin-27-centered cytokine circuit regulates macrophage and T cell interactions in autoimmune diabetes

Affiliations

An interleukin-27-centered cytokine circuit regulates macrophage and T cell interactions in autoimmune diabetes

Ashley E Ciecko et al. iScience. .

Abstract

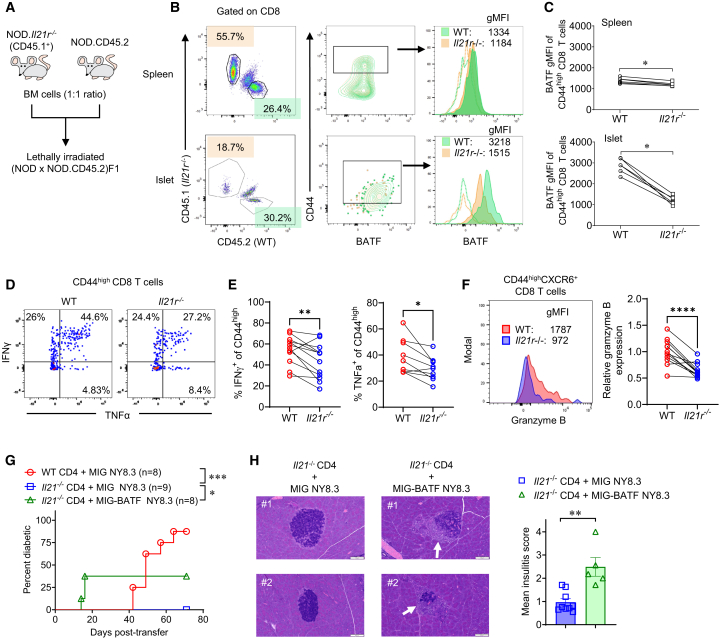
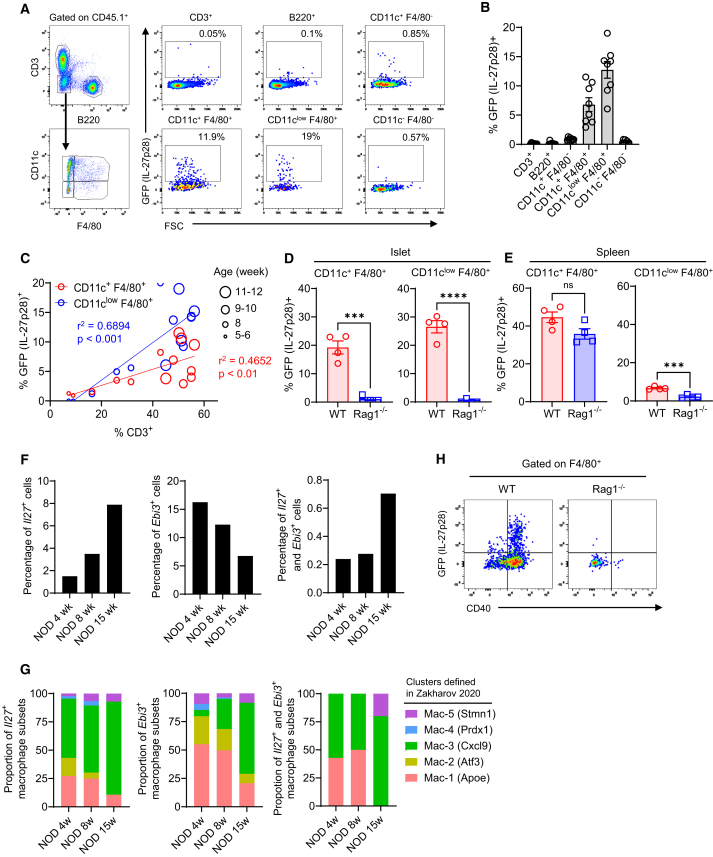
In the non-obese diabetic (NOD) mouse model of autoimmune diabetes, interleukin (IL)-27 stimulates interferon γ (IFNγ) production by CD4 and CD8 T cells and is essential for disease development. Here, we tested the role of IL-27 in cellular communication. Single-cell RNA sequencing and T cell adoptive transfer showed that IL-27 intrinsically controlled the differentiation of islet-infiltrating CD4 T cells by driving them toward an IL-21+ Th1 phenotype. Consequently, IL-27 signaling in CD4 T cells was important for BATF and granzyme B expression in islet CD8 T effectors. BATF overexpression increased the diabetogenic potential of β cell autoreactive CD8 T cells lacking help from CD4 T cell-derived IL-21. Macrophages were the main source of IL-27 in the islets, whose expression correlated with T cell infiltration. IFNγ and CD40 signaling conferred by activated T cells induced macrophage IL-27 production. Collectively, our findings reveal a role for IL-27 in orchestrating interconnected positive feedback loops involving CD4 T cells, CD8 T cells, and macrophages in autoimmune diabetes.

Keywords: Components of the immune system; Immune response; Immune system disorder.


Conflict of interest statement

The authors declare no competing interests.

Figures

None
Graphical abstract
Figure 1
Figure 1
Single-cell RNA sequencing of islet-infiltrating CD4 T cells in the wild-type (WT) and Il27ra−/− mixed bone marrow chimeras (A) Experimental design for the MBMC scRNA-seq analysis. At 10 weeks post-bone marrow reconstitution, islet-infiltrating cells were isolated and pooled from five MBMCs. WT and Il27ra−/− (knockout [KO]) T cells were sorted for sequencing library preparation and scRNA-seq analysis. (B) Integration of WT and Il27ra−/− (KO) islet-infiltrating CD4 T cells and pre-defined cell clusters reported in Ciecko et al. (see method details). ISG: IFN-stimulated genes. (C) Percentages of the WT and Il27ra−/− (KO) CD4 T cells in ISG (cluster 6), proliferating (clusters 11 and 12), Foxp3 (clusters 9 and 10), IL-21 (clusters 0, 3, 5, and 8), memory (cluster 4), and naive (clusters 1, 2, and 7) cell clusters. (D) Subset distribution of WT and Il27ra−/− (KO) IL-21 cluster cells (clusters 0, 3, 5, and 8). (E) Pseudotime analysis of WT and Il27ra−/− (KO) IL-21 cluster cells (clusters 0, 3, 5, and 8). ∗p < 0.05 by one-sided Kolmogorov-Smirnov test. (F) Differential gene expression between WT and Il27ra−/− (KO) IL-21 cluster cells. Genes with an adjusted p value < 0.05 and |log2FC| > 0.5 are considered significantly different and are colored in red (upregulated in WT) or blue (upregulated in Il27ra−/− [KO]). Genes of interest are labeled. (G) Gene module score comparison between WT and Il27ra−/− (KO) IL-21 cluster cells (clusters 0, 3, 5, and 8). ∗p < 0.05, ∗∗p < 0.0001 by Wilcoxon rank-sum test.
Figure 2
Figure 2
IL-27 signaling in CD4 T cells impacts CD8 T cells (A) Schematic diagram of CD4 and CD8 T cell co-transfer into NOD.Rag1−/− recipients for analyzing Venus (IL-21)-expressing CD4 T cells. (B and C) IL-27 signaling in CD4 T cells promotes their IL-21 expression. Islet-infiltrating CD4 T cells were analyzed by flow cytometry for Venus (IL-21) expression at 8–9 weeks post-transfer. (B) Representative flow cytometry profiles of Venus (IL-21) and CXCR6 expression. (C) Summarized percentages of Venus (IL-21)+ cells among CD4 T cells (upper) and CXCR6+ cells among Venus (IL-21)+ CD4 T cells (lower). Combined results from two independent experiments are shown (n = 5 per group). ∗∗p < 0.01, unpaired t test. (D) Schematic diagram of CD4 and CD8 T cell co-transfer into NOD.Rag1−/− recipients for analyzing the phenotype of CD8 T cells. (E) Representative histograms showing BATF expression in CD44high CD8 T cells in the spleens (dotted lines) and pancreatic islets (shaded areas). gMFI, geometric mean fluorescent intensity. (F) Summarized BATF gMFI of spleen and islet CD44high CD8 T cells. Combined results from two independent transfer experiments are shown (n = 6–7 per group). ∗∗∗p < 0.005, unpaired t test. (G) The BATF regulon activity in IGRP206-241-specific CD8 T cells isolated from pancreatic islets and spleens. The BATF regulon activity was computed by SCENIC using a previously published scRNA-seq dataset (GSE200608). The p value is determined by Wilcoxon test. (H and I) IFNγ and TNFα expression in islet-infiltrating CD8 T cells co-transferred with WT or Il27ra−/− CD4 T cells. (H) Representative flow cytometry profiles of IFNγ and TNFα expression. (I) Summarized percentages of IFNγ+ (left) and TNFα+ (right) CD44high CD8 T cells. Combined results from two independent transfer experiments are shown (n = 5–6 per group). (J) Granzyme B expression in islet-infiltrating CD8 T cells co-transferred with WT or Il27ra−/− CD4 T cells. Representative histograms of granzyme B expression (left). Summarized relative granzyme B expression (right). Granzyme B gMFI of CD44highCXCR6+ CD8 T cells co-transferred with Il27ra−/− CD4 T cells is normalized to those co-transferred with WT CD4 T cells in each experiment. Combined results from three independent transfer experiments are shown (n = 10 per group). ∗p < 0.05, unpaired t test.
Figure 3
Figure 3
IL-21 controls the effector functions of CD8 T cells (A) Schematic diagram of generating MBMCs. (B) Representative flow cytometry profiles showing the gating strategy for analyzing BATF expression in CD44high CD8 T cells. Cells were stained with purified rabbit anti-mouse BATF primary antibody followed by fluorochrome-conjugated anti-rabbit IgG secondary antibody. The solid lines and shaded areas in the histograms, respectively, represent staining without and with the primary antibody. WT, wild type. gMFI: geometric mean fluorescent intensity. (C) Summarized BATF gMFI of spleen and islet CD44high CD8 T cells. Combined results from two independent experiments are shown (n = 6 per group). ∗p < 0.05, paired t test. (D and E) The ability to produce IFNγ and TNFα is reduced in islet-infiltrating CD8 T cells in the absence of IL-21 signaling. (D) Representative flow cytometry profiles of IFNγ and TNFα expression. (E) Summarized percentages of IFNγ+ (left) and TNFα+ (right) CD44high CD8 T cells. Combined results from three to four independent experiments are shown (n = 9–12 per group). ∗p < 0.05, ∗∗p < 0.01, paired t test. (F) Granzyme B expression in islet-infiltrating CD8 T cells is reduced in the absence of IL-21 signaling. Representative histogram of granzyme B expression (left). Summarized relative granzyme B expression (right). Granzyme B gMFI of Il21r−/− CD44highCXCR6+ CD8 T cells is normalized to that of the WT counterpart in each MBMC experiment. Combined results from four independent experiments are shown (n = 12 per group). ∗∗∗∗p < 0.0001, paired t test. (G and H) Forced expression of BATF rescues the diabetogenic activity of CD8 T cells in the absence of CD4 T cell-derived IL-21. NY8.3 CD8 T cells were activated in vitro and transduced with either empty MIG or MIG-BATF retroviral vector (see method details). A mixture of 5 × 10⁶ transduced NY8.3 CD8 T cells along with 5 × 10⁶ WT or Il21−/− NOD CD4 T cells was transferred into NOD.Rag1−/− female recipients. Mice were monitored for diabetes development. (G) The percentages of mice that developed diabetes over time are shown. Data are combined from two independent experiments with eight to nine total mice per group. ∗p < 0.05, ∗∗∗p < 0.001 by log rank test. (H) Representative islet images and the summary of insulitis in mice that remained nondiabetic at termination of the incidence study. Arrows indicate infiltrating immunocytes. Scale bars, 100 μm. ∗∗p < 0.005, unpaired t test.
Figure 4
Figure 4
Activated macrophages produce IL-27 in islets of NOD mice (A) Representative flow cytometry profiles showing the gating strategy for identifying GFP (IL-27p28)-expressing cells in the islets of NOD.Il27p28-eGFP mice. Gating of GFP (IL-27p28)+ cells was based on an Il27p28-eGFP-negative mouse. (B) The frequencies of GFP (IL-27p28)+ cells summarized from two independent experiments using 9- to 12-week-old females are shown (n = 8). (C) Correlation between the frequencies of CD3+ T cells and GFP (IL-27p28)+ macrophages in 5- to 12-week-old NOD.Il27p28-eGFP females. Each symbol represents one mouse. (D and E) Percentages of GFP (IL-27p28)+ cells in (D) islet and (E) splenic CD11c+F4/80+ and CD11clowF4/80+ cells of 11-week-old wild-type (WT) and 17-week-old Rag1−/− NOD.Il27p28-eGFP female mice (n = 4 per group). ∗∗∗p < 0.001, ∗∗∗∗p < 0.0001, unpaired t test. ns, not significant. (F) Percentages of total Il27+ (left), total Ebi3+ (middle), and Il27+Ebi3+ (right) cells among islet macrophages. (G) Proportions of different islet macrophage subpopulations among total Il27+ (left), total Ebi3+ (middle), and Il27+Ebi3+ (right) cells. Results from (F and G) were generated using a previously published scRNA-seq dataset (GSE141786). (H) Representative flow cytometry profiles showing the expression of GFP (IL-27p28) in activated (CD40high) F4/80+ islet macrophages of WT and Rag1−/− NOD.Il27p28-eGFP mice.
Figure 5
Figure 5
T cells stimulate macrophage IL-27 production by IFNγ signaling and CD40-CD40L interaction (A) CD40L blockade suppresses IL-27 expression in islet macrophages. NOD.Il27p28-eGFP females (6–9 weeks old) were injected with anti-CD40L or control antibodies weekly for 3 weeks. Islet-infiltrating cells were analyzed at 1 week after the last injection. The frequencies of GFP (IL-27p28)+ cells among CD11c+F4/80+ and CD11clowF4/80+ macrophages are pooled from four independent experiments (n = 11–12 per group). ∗p < 0.05 by unpaired t test. (B) IFNγ signaling is important for islet macrophage production of IL-27. Islet-infiltrating cells were analyzed for GFP (IL-27p28) in NOD.Ifngr1+/+ and NOD.Ifngr1+/− female littermates (9–11 weeks old). The frequencies of GFP (IL-27p28)+ cells among CD11c+F4/80+ and CD11clowF4/80+ macrophages are pooled from six independent experiments (n = 10–13 per group). ∗p < 0.05 by unpaired t test. (C) IFNγR and CD40L blockade reduces IL-27p28 production in the coculture of wild-type (WT) CD4 T cells and BMDMs. WT splenic CD4 T cells (1 × 10⁶) were cocultured with WT BMDMs (2 × 10⁵) in the presence or absence of anti-CD3 (2 μg/mL) with the addition of anti-IFNγR and/or anti-CD40L (10 μg/mL) or the corresponding control antibodies for 3 days. Culture media were collected and analyzed for IL-27p28 by ELISA. Summarized results are from four independent experiments as indicated by different symbols. ∗p < 0.05, ∗∗p < 0.01, ∗∗∗p < 0.001, one-way ANOVA followed by Tukey’s multiple comparison. (D) IFNγR blockade reduces IL-27p28 production in the coculture of WT CD8 T cells and BMDMs. WT CD8 T cells and WT BMDMs were cocultured as described in (C). Culture media were collected and analyzed for IL-27p28 by ELISA. Summarized results are from two independent experiments with two biological replicates each time. ∗∗p < 0.01, one-way ANOVA followed by Tukey’s multiple comparison. (E) The ability of macrophages to respond to IFNγ is important for CD4 T cell-induced IL-27p28 production. WT splenic CD4 T cells (1 × 10⁶) were cocultured with WT or Ifngr1−/− BMDMs (2 × 10⁵) in the presence or absence of anti-CD3 (2 μg/mL) for 3 days. Culture media were collected and analyzed for IL-27p28 by ELISA. Results were pooled from two independent experiments with two biological replicates each time. ∗∗∗p < 0.001, ∗∗∗∗p < 0.0001, one-way ANOVA followed by Tukey’s multiple comparison. (F) IFNγ and CD40 signaling synergistically enhances macrophage IL-27p28 expression. BMDMs were stimulated with IFNγ (10 ng/mL), anti-CD40 (5 μg/mL), or both for 3 days. Culture media were collected and analyzed for IL-27p28 by ELISA. Results were pooled from three independent experiments with one to two biological replicates each time. ∗p < 0.05, ∗∗p < 0.01, ∗∗∗∗p < 0.0001, one-way ANOVA followed by Tukey’s multiple comparison. (G) IFNγR and CD40L blockade reduces IL-27 production in the coculture of WT CD4 T cells and BMDMs. Culture media from the same cultures shown in (C) were analyzed for IL-27p28/EBI3 heterodimers by ELISA. ∗∗p < 0.01, ∗∗∗p < 0.001, one-way ANOVA followed by Tukey’s multiple comparison. (H) Activated human T cells induce IL-27 p28/EBI3 heterodimer production in the PBMC culture. PBMCs (7.5 × 10⁵) were cultured in the presence or absence of anti-CD3 (2 μg/mL) with the addition of anti-IFNγRα and/or anti-CD40L (10 μg/mL) or the corresponding control antibodies for 3 days. Culture media were collected and analyzed for IL-27p28/EBI3 heterodimers by ELISA. Summarized results are from eight subjects as indicated by different symbols. ∗Adjusted p < 0.05 by Wilcoxon signed-rank test.

References

    1. Herold K.C., Delong T., Perdigoto A.L., Biru N., Brusko T.M., Walker L.S.K. The immunology of type 1 diabetes. Nat. Rev. Immunol. 2024;24:435–451. doi: 10.1038/s41577-023-00985-4. - DOI - PMC - PubMed
    1. Spolski R., Kashyap M., Robinson C., Yu Z., Leonard W.J. IL-21 signaling is critical for the development of type I diabetes in the NOD mouse. Proc. Natl. Acad. Sci. USA. 2008;105:14028–14033. doi: 10.1073/pnas.0804358105. 0804358105 [pii] - DOI - PMC - PubMed
    1. Sutherland A.P.R., Van Belle T., Wurster A.L., Suto A., Michaud M., Zhang D., Grusby M.J., von Herrath M. Interleukin-21 is required for the development of type 1 diabetes in NOD mice. Diabetes. 2009;58:1144–1155. doi: 10.2337/db08-0882. db08-0882 [pii] - DOI - PMC - PubMed
    1. McGuire H.M., Walters S., Vogelzang A., Lee C.M.Y., Webster K.E., Sprent J., Christ D., Grey S., King C. Interleukin-21 is critically required in autoimmune and allogeneic responses to islet tissue in murine models. Diabetes. 2011;60:867–875. doi: 10.2337/db10-1157. - DOI - PMC - PubMed
    1. Allred M.G., Chimenti M.S., Ciecko A.E., Chen Y.G., Lieberman S.M. Characterization of type I interferon-associated chemokines and cytokines in lacrimal glands of nonobese diabetic mice. Int. J. Mol. Sci. 2021;22 doi: 10.3390/ijms22073767. - DOI - PMC - PubMed

LinkOut - more resources