. 2025 Dec;30(1):2565861.
doi: 10.1080/13510002.2025.2565861. Epub 2025 Oct 6.

Scutellarin suppresses Mycobacterium tuberculosis-induced pyroptosis in macrophages by inhibiting the HIF-1α-mediated Warburg effect

Affiliations

Scutellarin suppresses Mycobacterium tuberculosis-induced pyroptosis in macrophages by inhibiting the HIF-1α-mediated Warburg effect

Jianchao Wu et al. Redox Rep. 2025 Dec.

Abstract

Background: Mycobacterium tuberculosis (Mtb), the causative agent of tuberculosis (TB), remains a major global health threat due to prolonged treatment and drug-resistant strains. Host-directed therapy (HDT), which modulates host-pathogen interactions, offers potential to shorten treatment and limit resistance. This study investigates the effects of Scutellarin (SCU), a flavonoid from Scutellaria baicalensis, on Mtb-infected macrophages within the HDT framework.

Methods: Anti-pyroptotic and anti-inflammatory effects of SCU were assessed in Mtb-infected THP-1 and J774A.1 macrophages, and in a lipopolysaccharide (LPS)-induced acute lung injury (ALI) mouse model. Mitochondrial function was evaluated by oxygen consumption rate(OCR), membrane potential, and superoxide levels; glycolytic activity was measured by proton efflux rate (GlycoPER). Expression of inflammasome-related markers was analyzed by Western blot, qPCR, ELISA, immunofluorescence, and flow cytometry. The role of hypoxia-inducible factor 1-alpha (HIF-1α) was examined via siRNA knockdown.

Results: SCU inhibited NLRP3 inflammasome activation, reduced IL-1β and IL-18 secretion, and attenuating pyroptosis. It restored mitochondrial integrity by regulating p-DRP1, MFN2, and Cytochrome C expression, and suppressed HIF-1α-mediated glycolytic reprogramming. Silencing of HIF-1α confirmed its role in SCU's mechanism. In vivo, SCU reduced pulmonary inflammation and cytokine release in LPS-induced ALI.

Conclusion: SCU alleviates Mtb-induced pyroptosis and inflammation in macrophages by inhibiting the HIF-1α-mediated Warburg effect.

Keywords: Mitochondrial dysfunction; Mycobacterium tuberculosis; NLRP3 inflammasome; Pyroptosis; Scutellarin; Warburg effect; host-directed therapy; hypoxia-inducible factor-1α.


Conflict of interest statement

No potential conflict of interest was reported by the author(s).

Figures

Figure 1.
Figure 1.
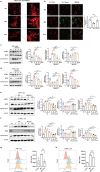
Effect of SCU on Macrophage Activity.a The chemical structure of SCU is, (2S,3S,4S,5R,6S)-6-[5,6-dihydroxy-2-(4-hydroxyphenyl)-4-oxochromen-7-yl]oxy-3,4,5-trihydroxyoxane-2-carboxylic acid (Molecular formula: C21H18O12; Molecular weight: 462.36; CAS Registry Number: 27740-01-8; PubChem CID: 185617). b THP-1 cell viability after exposure to SCU (10–80 μM) for 24, 48, and 72 h, measured using the MTT assay (n = 4).c J774A.1 cell viability after exposure to SCU (10–80 μM) for 24, 48, and 72 h, measured using the MTT assay (n = 4).*p < 0.05, **p < 0.01, and ***p < 0.001.
Figure 2.
Figure 2.
Evaluation of real-time glycoPER and OCR in Mtb-infected THP-1 and J774A.1 cells after SCU treatment.a-b Glycolysis rate test plots for THP-1 and J774A.1 cells(n = 3).c-d Energy map at the first time point of the glycolysis rate test for THP-1 and J774A.1 cells(n = 3).e-f Basal glycolysis for THP-1 and J774A.1 cells(n = 3).g-h Compensatory glycolysis for THP-1 and J774A.1 cells (n = 3).i-j Basal proton efflux rate for THP-1 and J774A.1 cells (n = 3).k-l Post-2-DG acidification for THP-1 and J774A.1 cells (n = 3).m-n Mitochondrial stress test plots for THP-1 and J774A.1 cells(n = 3).o-p Basal respiration for THP-1 and J774A.1 cells (n = 3).q-r ATP production from mitochondrial oxidative phosphorylation for THP-1 and J774A.1 cells (n = 3).ns: not statistically significant, *p < 0.05, **p < 0.01, and ***p < 0.001.
Figure 3.
Figure 3.
SCU inhibits Mtb damage to mitochondrial metabolism in THP-1 and J774A.1 cells.a Changes in mitochondrial morphology of THP-1 cells treated with different concentrations of SCU were observed by confocal microscopy using Mitotracker staining(n = 3). The white arrow points to the mitochondria.b Mitochondrial membrane potential changes in THP-1 cells were assessed using JC-1 staining and observed by confocal microscopy(n = 3). Bar graphs show the statistical results of mitochondrial membrane potential intensity for each group. The white arrow points to the mitochondria.c-d The expression levels of p-DRP1, MFN2, and Cytochrome C proteins in THP-1 and J774A.1 cells treated with 20, 40, and 80 μM SCU were detected by western blotting(n = 3). Bar graphs show the quantification of grey scale values for the protein levels in each group.e-f The expression levels of p-DRP1, MFN2, and Cytochrome C proteins in THP-1 and J774A.1 cells after 40 μM SCU treatment for different time points (6, 12, and 24 h) were detected by western blotting(n = 3). Bar graphs show the quantification of grey scale values for the protein levels in each group.g-h Mitochondrial ROS levels in THP-1 and J774A.1 cells were detected by flow cytometry using the mitochondrial superoxide indicator MitoSOX(n = 3). Bar graphs show the statistical results of mitochondrial ROS mean fluorescence intensity (MFI) for each group.ns: not statistically significant, *p < 0.05, **p < 0.01, and ***p < 0.001.
Figure 4.
Figure 4.
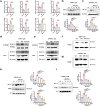
SCU Inhibits Inflammation and Pyroptosis in Mtb-Infected THP-1 and J774A.1 Cells.a The expression levels of NLRP3, GSDMD-N, Cleaved-Caspase-1, and HMGB1 proteins in THP-1 cells treated with 20, 40, and 80 μM of SCU were detected by western blotting(n = 3). Bar graphs represent the quantification of protein levels from grey scale values.b The levels of NLRP3, GSDMD-N, cleaved caspase-1, and HMGB1 proteins in THP-1 cells treated with 40 μM SCU for different durations (6, 12, and 24 hours) were detected by western blotting(n = 3). Bar graphs present the statistics of protein levels from grey scale values.c The expression levels of NLRP3, GSDMD-N, cleaved caspase-1, and HMGB1 proteins in J774A.1 cells treated with 20, 40, and 80 μM of SCU were detected by western blotting(n = 3). Bar graphs represent the quantification of protein levels from grey scale values.d The levels of NLRP3, GSDMD-N, cleaved caspase-1, and HMGB1 proteins in J774A.1 cells treated with 40 μM SCU for different durations (6, 12, and 24 hours) were detected by western blotting(n = 3). Bar graphs present the statistics of protein levels from grey scale values.e-f The expression of ASC proteins cross-linked with DSS in THP-1 and J774A.1 cells treated with different concentrations of SCU was measured by western blotting(n = 3).g-h The levels of LDH released into the supernatants of THP-1 and J774A.1 cells were measured using the LDH Cytotoxicity Assay Kit(n = 3). SCU was treated at a concentration of 40 μM.i-j The inhibitory effect of different concentrations of SCU on Mtb-induced IL-1β release from THP-1 and J774A.1 cells was assessed by ELISA(n = 4).k-l The inhibitory effect of different concentrations of SCU on Mtb-induced IL-18 release from THP-1 and J774A.1 cells was assessed by ELISA (n = 4). ns: not statistically significant, *p < 0.05, **p < 0.01, and ***p < 0.001.
Figure 5.
Figure 5.
SCU inhibits HIF-1α-induced aerobic glycolysis.a The mRNA expression levels of HK1, HK2, SLC2A1, PFKFB3, PGAM1, HIF-1α, PKM2, and ALDOB were assessed by qRT-PCR in THP-1 cells(n = 3).b-c The expression levels of HIF-1α proteins were detected by western blotting in THP-1 and J774A.1 cells treated with 20, 40, and 80 μM SCU(n = 3). Bar graphs show the quantification of the grey scale values of protein levels for each group.d-e Co-IP assay was performed to detect the interaction between HIF-1α and PKM2 in THP-1 and J774A.1 cells(n = 3). F-g Western blotting was used to detect the expression of PKM2 protein cross-linked using DSS in THP-1 and J774A.1 cells treated with different concentrations of SCU(n = 3).h-i The levels of HIF-1α and PKM2 proteins in the nuclei of THP-1 and J774A.1 cells after nucleoplasmic separation were detected by western blotting at 20, 40, and 80 μM SCU(n = 3). Bar graphs show the quantification of the grey scale values of protein levels for each group. ns: not statistically significant, *p < 0.05, **p < 0.01, and ***p < 0.001.
Figure 6.
Figure 6.
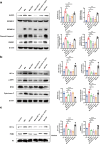
SCU protects mitochondrial metabolism in macrophages by inhibiting HIF-1α.a After transfection of small interfering RNA (siRNA) targeting HIF-1α in THP-1 cells, the expression levels of NLRP3, GSDMD-N, Cleaved-Caspase-1, and HMGB1 proteins were detected by western blotting(n = 3). Bar graphs show the quantification of grey scale values for the protein levels in each group.b After transfection of siRNA targeting HIF-1α in THP-1 cells, the levels of p-DRP1, MFN2, and Cytochrome C proteins were detected by western blotting(n = 3). Bar graphs show the quantification of grey scale values for the protein levels in each group.c After transfection of siRNA targeting HIF-1α in THP-1 cells, the expression levels of HIF-1α and PKM2 proteins in the nuclei of the cells after nucleoplasmic separation were detected by western blotting(n = 3). Bar graphs show the quantification of grey scale values for the protein levels in each group. ns: not statistically significant, *p < 0.05, **p < 0.01, and ***p < 0.001.
Figure 7.
Figure 7.
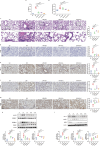
SCU attenuates LPS-induced acute lung injury and inflammatory cytokine expression in mice by in vivo inhibition of HIF-1α.a Serum levels of IL-1β in mice (n = 5) were detected by ELISA.b Lactate levels in mouse lung tissue homogenates were detected using a lactate assay kit (n = 6).c Lung tissues from mice were stained with H&E (20×), with dexamethasone (DEX) used as a positive control(n = 3). Bar graphs show the quantification of grey scale values for protein levels in each group. Scale bar = 150 μm.d Immunohistochemical images of F4/80 expression in mouse lung tissue (20×), and the positive area was quantified (n = 3). Bar graphs show the quantification of grey scale values for protein levels in each group. Scale bar = 150 μm.e-g Immunohistochemical images of HIF-1α, p-DRP1, and MFN2 expression in mouse lung tissue (20×), with the positive area quantified (n = 3). Bar graphs show the quantification of grey scale values for protein levels in each group. Scale bar = 150 μm.h-i The expression levels of NLRP3, GSDMD-N, HMGB1, HIF-1α, p-DRP1, MFN2, and Cytochrome C proteins in mouse lung tissues were detected by western blotting (n = 4). Bar graphs show the quantification of grey scale values for protein levels in each group. ns: not statistically significant, *p < 0.05, **p < 0.01, and ***p < 0.001.

References

    1. Nahid P, Dorman SE, Alipanah N, et al. Executive summary: official American thoracic society/centers for disease control and prevention/Infectious Diseases Society of America clinical practice guidelines: treatment of drug-susceptible tuberculosis [J]. Clin Infect Dis. 2016;63(7):853–867. doi: 10.1093/cid/ciw566 - DOI - PMC - PubMed
    1. Bagcchi S. WHO's global tuberculosis report 2022 [J]. Lancet Microbe. 2023;4(1):e20. doi: 10.1016/S2666-5247(22)00359-7 - DOI - PubMed
    1. Tsenova L, Singhal A.. Effects of host-directed therapies on the pathology of tuberculosis [J]. J Pathol. 2020;250(5):636–646. doi: 10.1002/path.5407 - DOI - PubMed
    1. Kilinç G, Saris A, Ottenhoff THM, et al. Host-directed therapy to combat mycobacterial infections [J]. Immunol Rev. 2021;301(1):62–83. doi: 10.1111/imr.12951 - DOI - PMC - PubMed
    1. Howard NC, Khader SA.. Immunometabolism during mycobacterium tuberculosis infection [J]. Trends Microbiol. 2020;28(10):832–850. doi: 10.1016/j.tim.2020.04.010 - DOI - PMC - PubMed

LinkOut - more resources