. 2025 Oct 5;13(10):e012314.
doi: 10.1136/jitc-2025-012314.

Hypoxia-induced RCOR2 promotes macrophage M2 polarization and CD8+ T-cell exhaustion by enhancing LIF transcription in hepatocellular carcinoma

Affiliations

Hypoxia-induced RCOR2 promotes macrophage M2 polarization and CD8+ T-cell exhaustion by enhancing LIF transcription in hepatocellular carcinoma

Wenbo Jia et al. J Immunother Cancer. .

Abstract

Background: The hypoxic microenvironment plays a crucial role in regulating the progression of hepatocellular carcinoma (HCC) and facilitating immune evasion. It is essential to gain a more comprehensive understanding of the pathways through which hypoxia influences HCC progression and immune evasion.

Methods: We employed RNA sequencing, The Cancer Genome Atlas (TCGA) data analysis, clinical data analysis of HCC, and tissue microarray immunohistochemical analysis to identify key genes associated with hypoxia regulation and immune evasion. We investigated the biological functions of REST corepressor 2 (RCOR2) in tumor progression and immune evasion through mass cytometry, multiplex immunofluorescence, an orthotopic liver transplantation tumor model, in vitro co-culture systems, flow cytometry, and immunohistochemical analysis. Additionally, we used molecular techniques such as RNA sequencing, chromatin immunoprecipitation sequencing, and mass spectrometry to gain deeper insights into the potential molecular mechanisms underlying RCOR2.

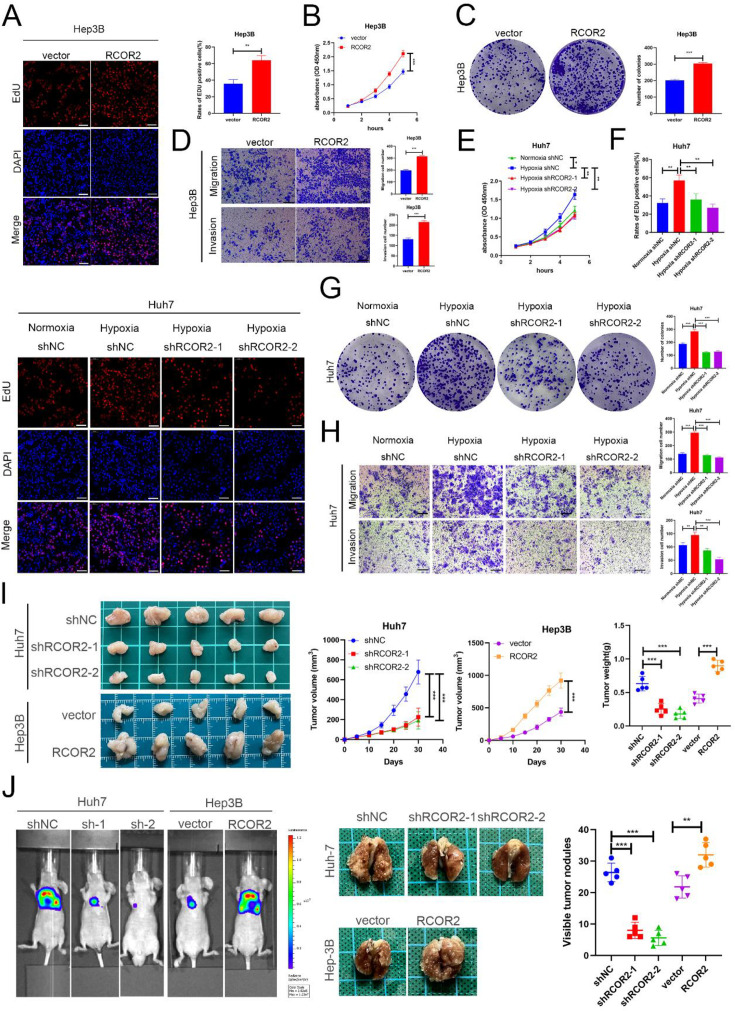
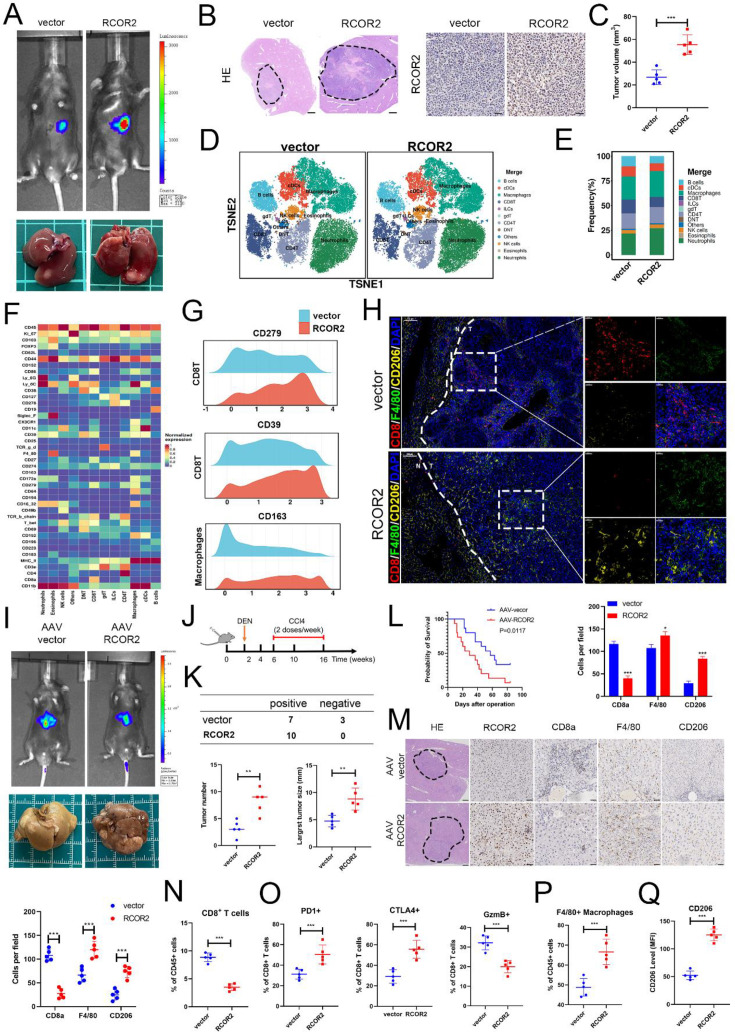
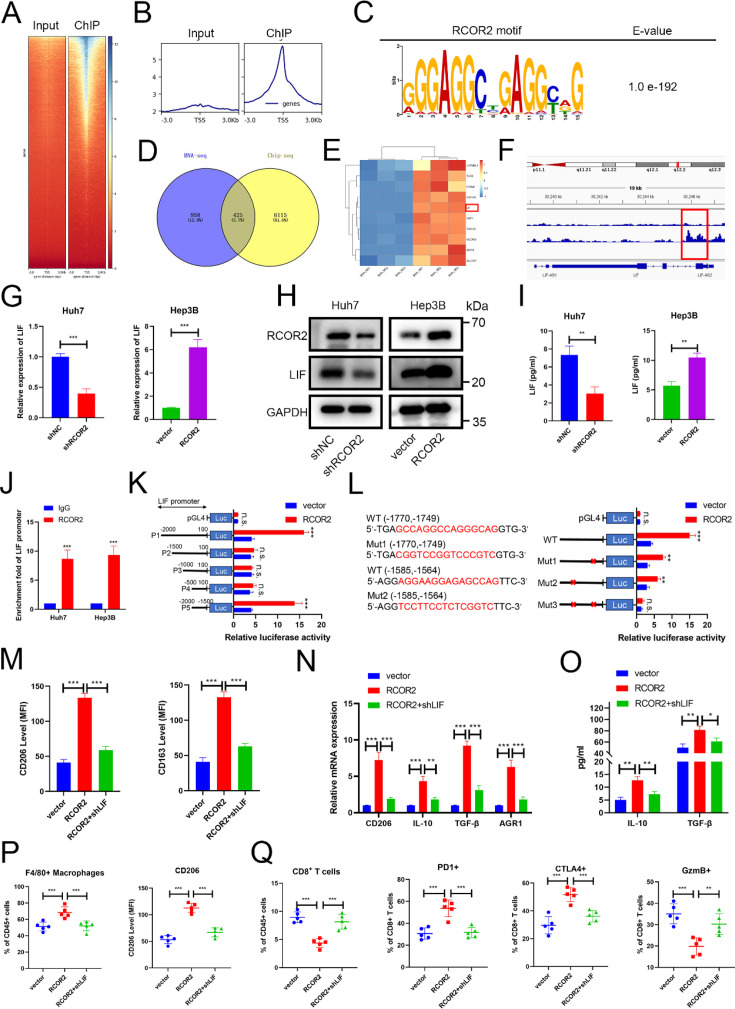
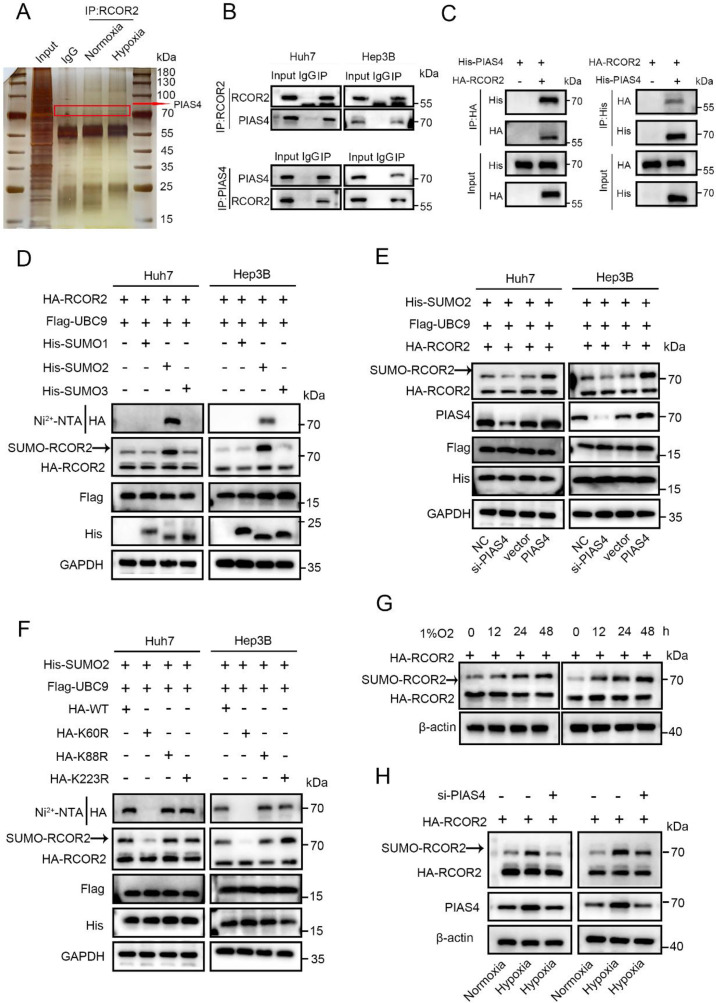
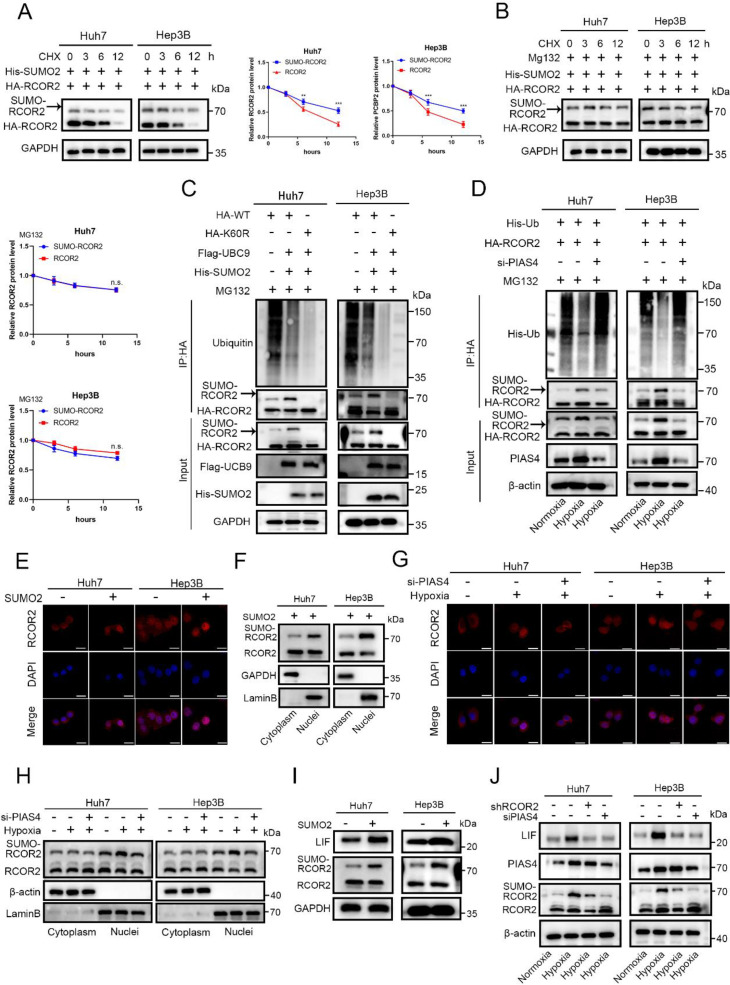
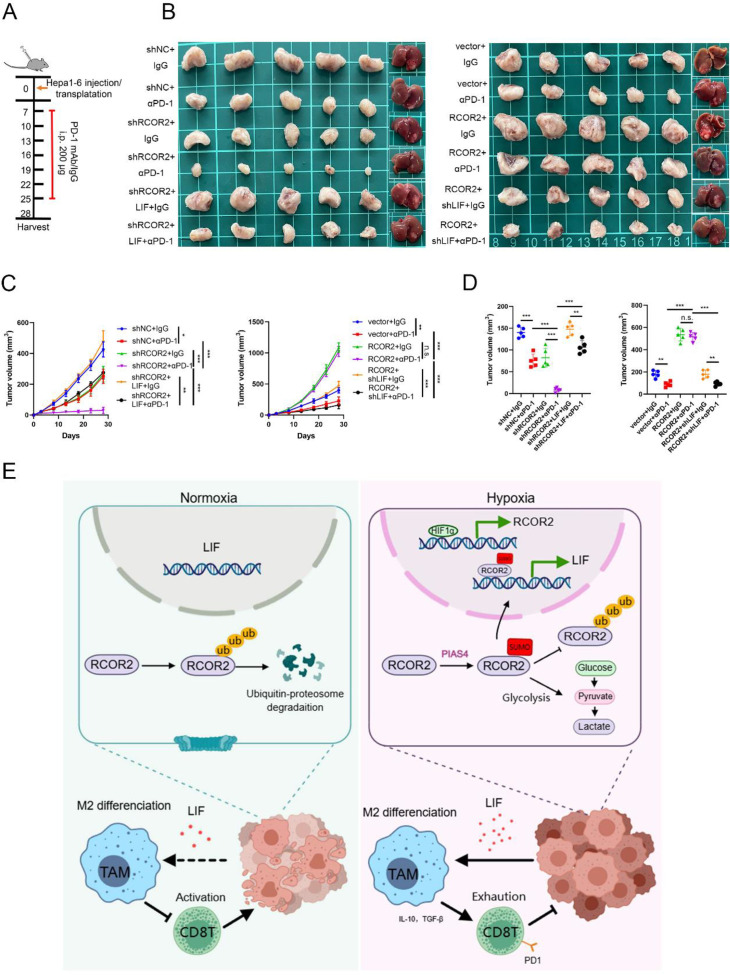
Results: We found that the hypoxia-related factor RCOR2 is upregulated in HCC and is associated with a poor prognosis. RCOR2 enhances the glycolytic process in HCC cells, thereby promoting the proliferation and metastasis of HCC cells under hypoxic conditions. Additionally, RCOR2 facilitates the M2 polarization of macrophages and contributes to the exhaustion of CD8+ T cells. Mechanistically, the hypoxic microenvironment increases the expression of RCOR2 through hypoxia-inducible factor 1-alpha. Concurrently, this microenvironment inhibits the ubiquitin-mediated degradation of RCOR2 by promoting its sumoylation, which facilitates its translocation to the nucleus. The sumoylation of RCOR2 further enhances the transcriptional activity of leukemia inhibitory factor (LIF). LIF, derived from HCC, contributes to the M2 polarization of macrophages, thereby facilitating immune evasion and playing a role in resistance to programmed cell death protein 1 (PD-1) therapies.

Conclusions: Our research reveals that the RCOR2/LIF axis within the hypoxic microenvironment of HCC plays a significant role in immune evasion and identifies novel biomarkers associated with tumor resistance to anti-PD-1 therapy. This study provides potential therapeutic targets for HCC.

Keywords: Hepatocellular Carcinoma; Immunotherapy; Macrophage.


Conflict of interest statement

Competing interests: No, there are no competing interests.

Figures

Figure 1
Figure 1. The hypoxia-related factor RCOR2 is a critical gene associated with poor prognosis and inhibits the infiltration of CD8+ T cells in HCC. (A) Volcano plots illustrate the results of high-throughput sequencing conducted on Huh7 and YY8103 cell lines cultured under normoxic or hypoxic conditions. (B) The infiltration levels of 29 immune cell types in 374 HCC sequencing samples from the TCGA database. (C) The Venn diagram illustrates proteins associated with hypoxia-induced responses and CD8+ T-cell infiltration. (D) Analysis of The TCGA data indicates that RCOR2 is significantly upregulated in HCC. (E) An analysis of TCGA data reveals a positive correlation between RCOR2 expression and the staging of HCC tissues. (FG) Survival analysis indicated that patients with HCC with elevated RCOR2 expression exhibited decreased overall (F) and disease-free survival times (G). (H–I) The quantitative real-time PCR (H) and western blot (I) results indicate that RCOR2 is upregulated in HCC tissues (T: HCC tissue, P: para-carcinoma tissue). (J) Survival analysis indicates that patients exhibiting elevated levels of RCOR2 expression experience a reduced overall survival duration. (K) Forest plot showing the results of multivariate analysis of factors associated with OS. (L–M) IHC staining was used to detect RCOR2 expression and CD8+ T-cell infiltration in HCC tissues (T: HCC tissue, P: para-carcinoma tissue). Scale bar: 200 µm and 50 µm. Bar graphs represent mean±SEM (n=3, *p<0.05, **p<0.01, and ***p<0.001). HBV, hepatitis B virus; HCC, hepatocellular carcinoma; IHC, immunohistochemistry; OS, overall survival; RCOR2, REST corepressor 2; TCGA, the Cancer Genome Atlas; TNM, tumor, node, metastasis.
Figure 2
Figure 2. RCOR2 promotes the proliferation and metastasis of HCC cells under hypoxic conditions. (A–C) EdU (A), CCK-8 (B), and colony formation (C) assays indicated that the overexpression of RCOR2 promoted the proliferation of HCC cells. Scale bar: 50 µm. (D) Transwell assay demonstrated that the overexpression of RCOR2 enhanced the migration and invasion of HCC cells. Scale bar: 200 µm. (E–G) The CCK8 (E), EdU (F), and colony formation (G) experiments indicate that the knockdown of RCOR2 inhibits the stimulatory effect of hypoxia on the proliferation of HCC cells. Scale bar: 50 µm. (H) The transwell experiment demonstrated that the knockdown of RCOR2 inhibited the enhancing effect of hypoxia on the migration and invasion of HCC cells. Scale bar: 200 µm. (I) A subcutaneous tumor model was utilized to detect the proliferation of RCOR2-deficient Huh7 cells and RCOR2-overexpressing Hep3B cells in vivo. Photograph of subcutaneous tumors (left), growth curve of subcutaneous tumors (middle), and weight of subcutaneous tumors (right). (J) A lung metastasis model was generated to detect the metastasis of HCC cells. In vivo image of nude mice (left), representative images of lungs (middle), and number of visible tumor nodules (right). Bar graphs represent mean±SEM (n=3, *p<0.05, **p<0.01, and ***p<0.001). DAPI, 4',6-diamidino-2-phenylindole; EdU, 5-ethynyl-20-deoxyuridine; CCK-8, cell counting kit-8; HCC, hepatocellular carcinoma; RCOR2, REST corepressor 2.
Figure 3
Figure 3. RCOR2 promotes the glycolytic process in hepatocellular carcinoma cells. (A) The RNA-seq volcano map of three pairs of RCOR2-overexpressing Hep3B cells and negative control cells. (B–C) GO enrichment analysis (B) and KEGG pathway analysis (C) of the RNA-seq results. (D) Gene Set Enrichment Analysis analysis of subsets of genes related to the glycolysis and ATP metabolic process. (E) The glucose consumption, lactate production, and ATP levels were measured in Hep3B cells overexpressing RCOR2. (F) The analysis of ECAR in Hep3B cells overexpressing RCOR2. ECAR levels after glucose injection reflect glycolysis rate, while ECAR levels after oligomycin injection reflect glycolytic capacity. (G) The analysis of OCR in Hep3B cells overexpressing RCOR2. OCR measured before oligomycin injection represents the basal respiratory rate, while OCR measured after FCCP injection represents the maximum respiratory rate. (H) The glucose consumption, lactate production, and ATP levels of Huh7 cells were measured under normoxic and hypoxic conditions. (I–J) The analysis of ECAR and OCR in Huh7 cells under hypoxic conditions. Bar graphs represent mean±SEM (n=3, *p<0.05, **p<0.01, and ***p<0.001). ECAR, extracellular acidification rate; FCCP, fluoro-carbonyl cyanide phenylhydrazone; GO, Gene Ontology; KEGG, Kyoto Encyclopedia of Genes and Genomes; OCR, oxygen consumption rate; RCOR2, REST corepressor 2; RNA-seq, RNA sequencing.
Figure 4
Figure 4. RCOR2 induces an inhibitory tumor immune microenvironment. (A) An orthotopic xenograft model was established in C57BL/6 mice. The lentivirus carrying a luciferase tag is shown in the in vivo images of the mice (above), along with representative images of the livers (below). (B) Immunohistochemistry of H&E, RCOR2 in orthotopic tumors. Scale bars: 200 µm and 50 µm. (C) The volume of orthotopic tumors. (D) T-SNE analysis of mass cytometry data of immune cells from orthotopic tumor tissues. (E) Comparative abundance of the tumor microenvironment in control versus RCOR2-overexpression orthotopic tumors. (F) The heatmap showing the expression of target proteins in all 12 subclusters. (G) Analyzing the density of CD279 and CD39 in CD8+ T cells, as well as the density of CD163 in macrophages. (H) Representative images from multiplex immunofluorescence analysis of CD8, F4/80, and CD206 markers in orthotopic tumors. Scale bars: 100 µm and 50 µm. (I) AAV-8 carrying the RCOR2 overexpression plasmid and luciferase tag was administered to mice via tail vein injection. In vivo image of mice (above), representative images of livers (below). (J) Workflow of the spontaneous HCC model. (K) The proportion of tumor positivity, tumor count, and maximum tumor volume were compared between the RCOR2 overexpression group and the control group in the spontaneous HCC model. (L) Survival analysis of RCOR2 overexpression in comparison to the control group in a spontaneous HCC model. (M) Immunohistochemistry of H&E, CD8a, F4/80, and CD206 in spontaneous tumors. Scale bars: 200 µm and 50 µm. (N) Flow cytometry analysis of the percentage of CD8+ T cells in CD45+TILs from spontaneous tumors. (O) Flow cytometry analysis of PD-1+, CTLA-4+, and GzmB+ (I) in CD8+T cells from spontaneous tumors. (P) Flow cytometry analysis of the percentage of macrophages in CD45+TILs from spontaneous tumors. (Q) Flow cytometry analysis of CD206+in macrophages from spontaneous tumors. Bar graphs represent mean±SEM (**p<0.01, and ***p<0.001). AAV-8, adeno-associated virus serotype 8; CTLA-4, cytotoxic T-lymphocyte associated protein 4; DEN, diethylnitrosamine; GzmB, granzyme B; HCC, hepatocellular carcinoma; PD-1, programmed cell death protein 1; RCOR2, REST corepressor 2; TILs, tumor-infiltrating lymphocytes; T-SNE, t-distributed stochastic neighbor embedding.
Figure 5
Figure 5. RCOR2 promotes CD8+T cell functional exhaustion by inducing M2 polarization of macrophages. (A) Schematic diagram showing HCC cells co-cultured with macrophages. (B–C) CD163 and CD206 expression in macrophages detected by flow cytometry. (D–E) Secreted IL-10 and TGF-β in the supernatants of macrophages detected by ELISA. (F–G) CD206, IL-10, and TGF-β messenger RNA levels in macrophages detected by qRT-PCR. (H–J) Flow cytometry analysis of the percentage of PD-1+ (H), CTLA-4+ (I), and GzmB+ (J) in CD8+ T cells. (K) Immunohistochemistry of RCOR2, CD8a, and F4/80 in orthotopic tumors. Scale bar: 50 µm. (L–M) Flow cytometry analysis of the percentage of CD8+T cells (L), and macrophages (M) in CD45+ TILs from orthotopic tumors. (N) Flow cytometry analysis of the percentage of PD-1+, CTLA4+, and GzmB+ in CD8+ T cells from orthotopic tumors. Bar graphs represent mean±SEM (n=3, *p<0.05, **p<0.01, and ***p<0.001). CTLA-4, cytotoxic T-lymphocyte associated protein 4; GzmB, granzyme B; HCC, hepatocellular carcinoma; IL, interleukin; PD-1, programmed cell death protein 1; qRT-PCR, quantitative real-time PCR; RCOR2, REST corepressor 2,TGF, transforming growth factor; TILs, tumor-infiltrating lymphocytes.
Figure 6
Figure 6. RCOR2 induces macrophage polarization by transcriptionally activating LIF. (A–B) Density plot showing the ChIP-sequencing result of high-confidence RCOR2 peaks, ranked by intensity. (C) The de novo motif logo of RCOR2 was derived from ChIP-sequencing data. (D) Venn diagram of overlapping genes between ChIP-sequencing and RNA-sequencing. (E) A heatmap illustrating the genes involved in macrophage differentiation, with genes identified in ChIP-sequencing analyses and RNA-seq analyses. (F) Enrichment of RCOR2 in the promoter region of LIF according to ChIP-sequencing. (G–I) qRT-PCR (G), western blot (H), and ELISA (I) were used for detecting LIF expression. (J) The ChIP experiment demonstrates that the LIF promoter fragment can be enriched by anti-RCOR2 antibodies. (K) Relative luciferase activities of reporters containing full-length or fragments of the LIF promoter. (L) Relative luciferase activities of different reporters containing wild type (WT) and mutated (Mut) sequences of the LIF promoter in the indicated cells. (M) Quantification of CD163 and CD206 expression in macrophages using flow cytometry analysis. (N) CD206, IL-10, TGF-β, and AGR1 mRNA levels in macrophages, detected by qRT-PCR analyses. (O) Secreted IL-10 and TGF-β in macrophage supernatants, detected using ELISA. (P) Flow cytometry analysis of the percentage of macrophages in CD45+ TILs, and CD206+ in macrophages from orthotopic tumors. (Q) Flow cytometry analysis of the percentage of CD8+ T cells in CD45+ TILs, PD-1+, CTLA-4+, and GzmB+ in CD8+ T cells from orthotopic tumors. Bar graphs represent mean±SEM (n=3, *p<0.05, **p<0.01, and ***p<0.001). ChIP, chromatin immunoprecipitation; CTLA-4, cytotoxic T-lymphocyte associated protein 4; GzmB, granzyme B; IL, interleukin; LIF, leukemia inhibitory factor; MFI, mean fluorescence intensity; mRNA, messenger RNA; PD-1, programmed cell death protein 1; qRT-PCR, quantitative real-time PCR; RCOR2, REST corepressor 2; RNA-seq, RNA sequencing; TGF, transforming growth factor; TILs, tumor-infiltrating lymphocytes.
Figure 7
Figure 7. Hypoxia enhances the SUMOylation of RCOR2 by upregulating PIAS4. (A) Immunoprecipitation was performed in Hep3B cells and detection by silver staining. The specific bands were marked with arrows. (B) The co-immunoprecipitation experiment demonstrates that RCOR2 physically interacts with PIAS4 in hepatocellular carcinoma cells. (C) Co-immunoprecipitation assay in HEK-293T cells co-transfected with HA-tagged RCOR2 and His-tagged PIAS4 plasmids showed that RCOR2 can directly interact with PIAS4. (D) An Ni-NTA pull-down assay was conducted to identify the specific type of sumoylation of RCOR2. (E) Western blot analysis was conducted to detect the regulatory effect of PIAS4 on the sumoylation of RCOR2. (F) Ni-NTA pull-down experiments validate the sumoylation site of RCOR2. (G) The western blot results indicate that hypoxia enhances the sumoylation modification of RCOR2. (H) PIAS4 knockdown inhibits the promoting effect of hypoxia on the sumoylation of RCOR2. RCOR2, REST corepressor 2.
Figure 8
Figure 8. Hypoxia promotes the stability and nuclear translocation of the RCOR2 protein by enhancing its SUMOylation. (A) The Western blot analysis indicates that SUMOylated RCOR2 is more stable than unmodified RCOR2. (B) The western blot analysis indicates that MG132 enhances the protein stability of unmodified RCOR2. (C) Ubiquitination detection indicates that the transfection of SUMO2 can inhibit the ubiquitination modification of RCOR2 by competitively binding to the K60 site. (D) Ubiquitination detection reveals that the inhibition of PIAS4 can reverse the suppressive impact of hypoxia on the ubiquitination of RCOR2. (E) Immunofluorescence analysis demonstrates that transfection of SUMO2 enhances the nuclear translocation of RCOR2. Scale bar: 50 µm. (F) The nuclear-cytoplasmic separation experiment detects the distribution of RCOR2 between the nucleus and cytoplasm. (G) Immunofluorescence analysis reveals that hypoxia enhances the nuclear translocation of RCOR2. Knocking down PIAS4 can counteract the hypoxia-induced promotion of RCOR2 nuclear translocation. Scale bar: 50 µm. (H) The nuclear-cytoplasmic separation experiment detects the distribution of RCOR2 in hypoxic hepatocellular carcinoma cells. (I) The western blot experiment demonstrated that the overexpression of SUMO2 enhanced the expression of LIF. (J) Hypoxia enhances the expression of LIF, and the knockdown of RCOR2 or PIAS4 can reverse the stimulatory effect of hypoxia on LIF expression. Bar graphs represent mean±SEM (n=3, **p<0.01, and ***p<0.001). DAPI, 4',6-diamidino-2'-phenylindole; LIF, leukemia inhibitory factor; RCOR2, REST corepressor 2.
Figure 9
Figure 9. The RCOR2/LIF axis is involved in PD-1 resistance. (A) Schematic view of the PD-1 treatment plan in subcutaneous tumors and orthotopic tumors. (B) Representative images of subcutaneous tumors and orthotopic tumors. (C) Growth curve of subcutaneous tumors. (D) Volume of orthotopic tumors. (D) The schematic diagram illustrates the mechanism of action of RCOR2 in hepatocellular carcinoma. Bar graphs represent mean±SEM (*p<0.05, **p<0.01, and ***p<0.001). IL, interleukin; LIF, leukemia inhibitory factor; PD-1, programmed cell death protein 1; RCOR2, REST corepressor 2; TAM, tumor-associated macrophage; TGF, transforming growth factor.

References

    1. Bray F, Laversanne M, Sung H, et al. Global cancer statistics 2022: GLOBOCAN estimates of incidence and mortality worldwide for 36 cancers in 185 countries. CA Cancer J Clin. 2024;74:229–63. doi: 10.3322/caac.21834. - DOI - PubMed
    1. Llovet JM, Zucman-Rossi J, Pikarsky E, et al. Hepatocellular carcinoma. Nat Rev Dis Primers. 2016;2 doi: 10.1038/nrdp.2016.18. - DOI - PubMed
    1. Shao C, Yang F, Miao S, et al. Role of hypoxia-induced exosomes in tumor biology. Mol Cancer. 2018;17:120. doi: 10.1186/s12943-018-0869-y. - DOI - PMC - PubMed
    1. Chen Z, Han F, Du Y, et al. Hypoxic microenvironment in cancer: molecular mechanisms and therapeutic interventions. Signal Transduct Target Ther. 2023;8:70. doi: 10.1038/s41392-023-01332-8. - DOI - PMC - PubMed
    1. Koukourakis MI, Giatromanolaki A, Skarlatos J, et al. Hypoxia inducible factor (HIF-1a and HIF-2a) expression in early esophageal cancer and response to photodynamic therapy and radiotherapy. Cancer Res. 2001;61:1830–2. - PubMed

MeSH terms

Substances