. 2025 Oct 6;15(1):359.
doi: 10.1038/s41398-025-03538-6.

Multi-connectomics underpin emotional dysfunction in mouse exposed to simulated space composite environment

Affiliations

Multi-connectomics underpin emotional dysfunction in mouse exposed to simulated space composite environment

Rong Liang et al. Transl Psychiatry. .

Abstract

Long-duration space exploration, including missions to the Moon and Mars, demands strategies to preserve astronauts' emotional well-being for optimal performance. This study combines behavioral phenotyping, multimodal MRI, in vivo calcium imaging, and brain-wide genomics to bridge macroscopic brain function with mesoscopic neural activity and microscopic genetic processes, providing a dynamic characterization of the mouse connectome under simulated spaceflight conditions. We observed a reduction in gray matter volume, particularly in the prefrontal cortex, with prolonged exposure. Simulated space composite environment (SSCE) disrupted multi-scale functional connectivity and altered the macro-organizational functional gradient, reversing the relationship between brain function and emotional behaviors. Neural activity in the medial prefrontal cortex demonstrated exposure-time-dependent changes across emotional tasks, while genetic analyses linked SSCE-induced alterations in functional profiles to synaptic function and ion channel activity. Our findings reveal how extreme environments impact emotional behaviors, brain networks, and neural activity, offering insights for interventions to maintain brain integrity during extended space missions.


Conflict of interest statement

Competing interests: The authors declare no competing interests. Ethics approval: All experiments on animal were conducted in accordance with the Declaration of Helsinkis. All animal experiments comply with the ARRIVE guidelines. All animal procedures involving animals were conducted in accordance with the approved protocol for the care and use of laboratory animals the Animal Care and Use Committee of Tianjin University (Animal license number: TJUE: 2023-105). All the authors compliance with all relevant ethical regulations.

Figures

Fig. 1
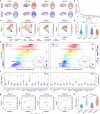
Fig. 1. Grey matter volume (GMV) differences between SSCE and CON groups.
a, b Schematic (a) and statistical results (b) of GMV differences between SSCE and CON after 2-week and 4-week modeling. c Difference in grey matter volumes of whole brain and prefrontal subregions. The statistical threshold is set as p < 0.05. Asterisks indicate significance from two-sample t-tests (*p < 0.05; ** p < 0.01; ***p < 0.001).
Fig. 2
Fig. 2. Global, edge-wise, network-wise and PFC-specific resting-state FC differences between SSCE and CON groups.
a To calculate the pairwise FC, 160 regions of interest (ROIs) were defined based on the TMBTA reference, with 80 in each hemisphere. Pearson correlations were calculated between the BOLD time series of all unique ROI pairs. A group-averaged region-wise FC matrix for the 2-week CON group is shown, reordered by network assignments. b The FC matrix is represented as a weighted network graph, with ROIs as nodes and their pairwise correlations as edges. For clarity, only the strongest 10% of edges are shown, with edge thickness and opacity scaling with the correlation value and node radius scaling with the weighted degree (the weighted sum of all edges connected to the node). c The regional functional connectivity strength is violin plotted and also projected on the brain surface for each group. Each dot represents a single region. Asterisks indicate the significance from paired t-tests after adjusting for multiple comparisons (*p < 0.05; ** p < 0.01; ***p < 0.001). d Edge-wise FC differences between SSCE and CON groups are represented with graph for both 2-week (top) and 4-week (bottom) modeling. Edge thickness and opacity scale with the effect size (red: SSCE > CON, blue: SSCE < CON); node radius scales with the weighted sum of effect size. For visualization, a statistical threshold of p < 0.001 is applied. e The LME model was performed to illustrate the interaction of condition (SSCE or CON) × time on FC. Chord diagram highlights edges with the significant interaction of modeling time and group (p < 0.001). f Network-wise FC differences between SSCE and CON groups for both 2-week (left) and 4-week (right) modeling are represented in matrix form. Significant network pairs are further highlighted in a chord diagram (red: SSCE > CON, blue: SSCE < CON, * p < 0.05). g The interaction of condition × timing on FC is visualized at the network level (* p < 0.05). h PFC-specific FC differences between SSCE and CON groups for both 2-week (top) and 4-week (bottom) modeling are represented with graphs. Edge thickness and opacity scale with the effect size (red: SSCE > CON, blue: SSCE < CON); node radius scales with the weighted sum of effect size. i PFC voxel-wise FC strength is displayed in raincloud plots and sagittal brain view for each group. Each dot represents a voxel within the PFC. Asterisks indicate the significance of paired t-tests after multiple comparisons adjustments (*p < 0.05; ** p < 0.01; ***p < 0.001).
Fig. 3
Fig. 3. Large-scale functional gradients in mice.
a The principal (top) and secondary (bottom) functional gradients are projected onto the brain surface mesh. b The explanation ratio of connectome gradients (components) derived from the template FC. c Scatter plots of whole-brain voxel-wise gradient score for each of the two functional gradients across different groups. Each dot represents a voxel, colored according to its functional system assignment. d The whole-brain voxel-wise gradient dispersion is violin plotted for each group. Each dot represents a single voxel. Asterisks indicate the significance of paired t-tests after adjusting for multiple comparisons (*p < 0.05, **p < 0.01, ***p < 0.001). e System-level distributions of the principal gradients for the 2-week group pair (left) and 4-week group pair (right). Bubble plots on the right represent the group differences in the gradient scores for each brain system, corrected for multiple comparisons (FWE-corrected at p < 0.05). The color of the circle represents the T-value of the paired t-test (red: SSCE > CON, blue: SSCE < CON). The size of the circle indicates the significance of the corresponding paired t-test. Radar plots of the T-values are also provided. f Pairwise comparison of within-network gradient dispersion for the 2-week group pair (left) and 4-week group pair (right). g Scatter plots of voxel-wise gradient scores of the PFC for the first two functional gradients in different groups. Each dot represents a voxel, colored according to its regional assignment. h The voxel-wise gradient dispersion in the PFC is violin plotted for each group. Each dot represents a single voxel. Asterisks indicate the significance of paired t-tests after adjusting for multiple comparisons (*p < 0.05, **p < 0.01, ***p < 0.001, FWE-corrected).
Fig. 4
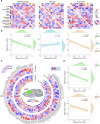
Fig. 4. Altered brain-behavior relationships in mice with SSCE exposure.
a Spearman’s correlation patterns between network-wise functional connectivity and three behavioral measures: the percentage of time in the open arms in the EPM: EPM-percentage (left), Stillness duration in the TST: TST-still (middle), sniffing time in the social test: Social-sniff (right). Note that, the upper and lower triangles of the matrix respectively represent the CON and SSCE groups after 4 weeks of modeling. Asterisks indicate correlations that passed the significance threshold of 0.05. b Contrasting network-wise brain-behavior relationships between the SSCE and the CON groups in terms of EPM and Social tests. c Circular heatmaps summarizing spearman’s correlations between PFC-specific ROI-wise FC and the three behavioral measures. The inner and outer arcs respectively represent the CON and SSCE groups after 4 weeks of modeling. The blocks outlined in black indicate correlations that passed the significance threshold of 0.05. d PFC-specific brain-behavior relationships in the SSCE group are the opposite of those in the CON group in terms of EPM and Social tests.
Fig. 5
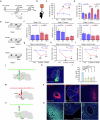
Fig. 5. Emotional responses and projection relationship between mPFC and NAc under simulated space complex environment.
a Schematic of the SSCE paradigm. b, e Experimental paradigms for TST (b) and SDT (e). c, d In the TST, the time that mice remain immobile within 5 min (Pre., pre-SSCE; 2 weeks, SSCE exposure for two weeks; 4 weeks, SSCE exposure for four weeks; CON: n = 5, SSCE: n = 5). f In stage 1 of SDT, the mouse’s sniffing time of empty boxes (CON: n = 5, SSCE: n = 5). g-i In stages 2 and 3 of SDT, the discrimination index of the sniffing of familiar (g, h) and novel mice (i). j, m, o Different viruses tracing strategy. k, n, p Injection site at NAc (k, n) and mPFC (p), tracing neurons in mPFC (n) and axon terminal in NAc (p), enlarged image. l Statistical results of the number of brain regions and their neurons projected into the NAc (mPFC, n = 9 slices/3 mice; AIV, Agranular insular cortex, ventral part, n = 4 slices/3 mice; Cg2, Cingulate cortex, n = 5 slices/3 mice; PV, Paraventricular thalamic nucleus, n = 6 slices/3 mice; BLA, Basolateral amygdala, n = 5 slices/3 mice).
Fig. 6
Fig. 6. Simulated space complex environment affects depression-like behaviors by reducing mPFCNAc neuronal activity.
a Schematic illustration of fiber photometry recording in vivo. b, c Representative images validate GCaMP6m expression in mPFCNAc neurons and optical fiber tract above the mPFC (b). c. Enlarged image boxed in (b). d Schematic of fiber photometry recording in TST. e, f Representative image (e) and peri-event plots (f) of ΔF/F Ca2+ signal changes from mPFCNAc neuron during immobility and struggling in TST. g Comparison of averaged ΔF/F of mPFCNAc signals in response to TST during the immobility and struggling. h, i Heatmap (h) and peri-event plots (i) of Ca2+ transients of mPFCNAc neuron during the struggling in SSCE (CON: n = 5 mice; SSCE: n = 5 mice). j-m The mean (j, k) and peak (l, m) Ca2+ signal change (ΔF/F) within 2 s during the struggling.
Fig. 7
Fig. 7. Simulated space complex environment affects social behaviors by reducing mPFCNAc neuronal activity.
a, e Schematic of fiber photometry recording in stage 2 (a) and stage 3 (e) of SDT. b, c, f, g Representative image (b, f) and peri-event plots (c, g) of ΔF/F Ca2+ signal changes from mPFCNAc neuron during sniffing the empty box, familiar mouse and novel mouse in SDT. d, h Comparison of averaged ΔF/F of mPFCNAc signals in response to SDT during sniffing the empty box, familiar mouse and novel mouse. i, j Heatmap (i) and peri-event plots (j) of Ca2+ transients of mPFCNAc neuron during sniffing the familiar mouse in stage 2 of SDT (CON: n = 5 mice; SSCE: n = 5 mice). l, m Heatmap (l) and peri-event plots (m) of Ca2+ transients of mPFCNAc neuron during sniffing the novel mouse in stage 3 of SDT. k, n The peak Ca2+ signal change (ΔF/F) within 5 s during sniffing the familiar mouse in stage 2 (k) and sniffing the novel mouse in stage 3 (n).
Fig. 8
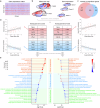
Fig. 8. Association between differences in PL-specific functional profiles and gene expression profiles.
a Normalized gene expression levels across 157 ROIs. b Brain surface projections of effect size values for the 2-week and 4-week comparison pairs (left) and gene expression levels. c Number of genes significantly correlated with the 2-week and 4-week effect size maps. d Significant genes are ranked in descending order according to their correlation coefficients. Scatter plots illustrate representative correlations between effect size values and gene expression levels. e GO enrichment analysis of genes significantly correlated with differences in PL-specific functional profiles for the 2-week (left) and 4-week (right) comparison pairs. Enrichment in cellular components (orange), biological processes (blue) and molecular functions (green) is shown. Note that, q value represents the FDR-corrected p value. The color of the circle represents the enrichment score of each term. The size of the circle indicates the number of genes significantly enriched in each term.

References

    1. Amemiya S, Takao H, Hanaoka S, Ohtomo K. Global and structured waves of rs-fMRI signal identified as putative propagation of spontaneous neural activity. NeuroImage. 2016;133:331–40. - PubMed
    1. Yue J, Han SW, Liu X, Wang S, Zhao WW, Cai LN, et al. Functional brain activity in patients with amnestic mild cognitive impairment: an rs-fMRI study. Front Neurol. 2023;14:1244696. - PMC - PubMed
    1. Raimondo L, Oliveira LAF, Heij J, Priovoulos N, Kundu P, Leoni RF, et al. Advances in resting state fMRI acquisitions for functional connectomics. NeuroImage. 2021;243:118503. - PubMed
    1. Liao Y, Lei M, Huang H, Wang C, Duan J, Li H, et al. The time course of altered brain activity during 7-day simulated microgravity. Front Behav Neurosci. 2015;9:124. - PMC - PubMed
    1. Koppelmans V, Bloomberg JJ, Mulavara AP, Seidler RD. Brain structural plasticity with spaceflight. npj Microgravity. 2016;2:2. - PMC - PubMed

LinkOut - more resources