. 2025 Oct 6;16(1):698.
doi: 10.1038/s41419-025-08019-8.

Hepatic steatosis and pyroptosis are induced by the hepatitis B virus X protein via B56α-METTL3 interaction-mediated m6A modification of the NLRP3 mRNA

Affiliations

Hepatic steatosis and pyroptosis are induced by the hepatitis B virus X protein via B56α-METTL3 interaction-mediated m6A modification of the NLRP3 mRNA

Ze-Bang Du et al. Cell Death Dis. .

Abstract

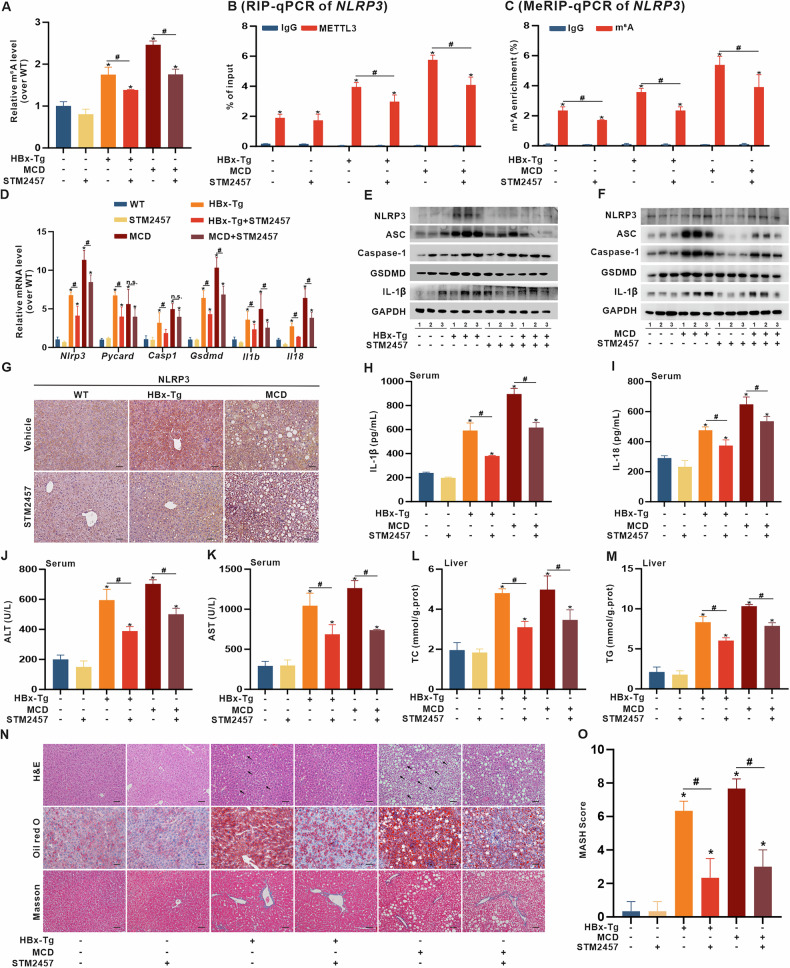
Metabolic dysfunction-associated steatohepatitis (MASH) is one of the fastest-growing chronic liver diseases and is characterized by excessive steatosis, inflammation, and progressive liver injury. The hepatitis B virus (HBV) X protein (HBx) is a major viral factor that contributes to the onset and progression of MASH. Emerging evidence highlights the role of epigenetic modifications, particularly N6-methyladenosine (m6A), as prevalent modifications of mRNAs that play crucial roles in MASH pathogenesis by regulating mRNA stability, translation, processing, and nuclear export. However, the epigenetic mechanisms by which m6A modification contributes to HBx-related MASH remain poorly defined. In this study, we observed that NOD-like receptor protein 3 (NLRP3)-dependent pyroptosis and intracellular lipid accumulation are markedly elevated in the livers of HBx-transgenic (HBx-Tg) mice in vivo and in HBx-expressing hepatocytes in vitro, exacerbating liver injury and driving MASH progression. Integrated metabolomic and transcriptomic analyses of HBx-Tg mice revealed distinct gene expression alterations, suggesting a key role for m6A modification in mediating hepatic inflammation and lipotoxicity. Mechanistically, we identified methyltransferase-like 3 (METTL3) as a critical positive regulator of this process. HBx upregulated METTL3 expression and the m6A level of NLRP3 mRNA in HBx-expressing hepatocytes, whereas METTL3 knockdown or catalytic inactivation suppressed NLRP3-dependent pyroptosis. Further investigation revealed that METTL3 enhances NLRP3 mRNA stability via m6A modification at A2748 site in the coding sequence. Moreover, the protein phosphatase 2A (PP2A) B56α subunit was found to interact with the METTL3 methyltransferase domain (MTD), facilitating its enzymatic activity and further increasing NLRP3 m6A methylation, thereby promoting pyroptosis and lipid accumulation in HBx-expressing hepatocytes. Importantly, treatment with STM2457, a selective inhibitor targeting the METTL3 MTD, significantly attenuated hepatic inflammation, steatohepatitis, and lipotoxicity. Taken together, our findings advance the understanding of HBx-induced hepatic lipid accumulation, steatosis, inflammasome formation, and pyroptosis, and indicate that targeting METTL3 with STM2457 intervention is a promising approach for MASH treatment.


Conflict of interest statement

Competing interests: The authors declare no competing interests. Ethics: All methods were approved by the Ethical Committee for Animal Experimentation at Xiamen University (Ethics Approval No. XMULAC20220282, dated 2022-03-12) and conducted following the Guide for the Care and Use of Laboratory Animals. This study was conducted in accordance with the Declaration of Helsinki. Informed consent was obtained from all participants for the use of tissue samples and clinical data in experiments and for publication.

Figures

Fig. 1
Fig. 1. m6A modification is associated with lipotoxicity and NLRP3-mediated inflammation in HBx-related MASH in transgenic mice.
HBx-Tg mice were used to construct the MASH model, whereas C57BL/6 WT mice served as the negative control and MCD-fed mice as the positive model. n = 5 per group. A Schematic of the experimental MASH model in mice. B Representative images showing H&E, Oil red O, and Masson staining of liver tissues illustrating the histopathological phenotypes of MASH. Scale bar, 100 μm. C, D Levels of total cholesterol (TC) (C) and triglyceride (TG) (D) in liver tissues were detected using colorimetric assays. E, F Levels of ALT (E) and AST (F) in serum. G Relative mRNA levels of Nlrp3 and pyroptosis-related genes were measured by qRT-PCR. H Levels of HBx expression and NLRP3, ASC, Caspase-1, GSDMD, and IL-1β proteins were measured by WB. n = 3. I Representative images showing the IHC staining of NLRP3, GSDMD, and IL-1β in liver tissues. Scale bar, 100 μm. J, K Levels of IL-1β (J) and IL-18 (K) in serum. L, M Transcriptomic profiling was performed on liver tissues from WT mice (n = 4) and HBx-Tg mice (n = 4). L Volcano plot of DEGs. M Heatmap of m6A-related genes. N Pearson correlation analysis showing the relationship between mRNA levels of m6A-related genes. O Global RNA m6A levels in liver tissues were detected using colorimetric assays. P Protein levels of METTL3, METTL14, and WTAP were measured by WB. Q Representative images showing the IHC staining of METTL3, METTL14, and WTAP in liver tissues. Scale bar, 100 μm. Data are presented as mean ± SD. *, P < 0.05, compared to the WT group.
Fig. 2
Fig. 2. HBx upregulates NLRP3-mediated pyroptosis and MASH-associated METTL3 in HBx-expressing hepatocytes in vitro.
AL HepG2 cells were transfected with pcDNA3.1-HBx (1 μg/ml, 24 h) to construct HBx-expressing hepatocytes, while the negative control (NC) cells transfected with pcDNA3.1 vector served as controls. A, B Levels of TC (A) and TG (B) in cells. C Relative mRNA levels of NLRP3 and pyroptosis-related genes were measured by qRT-PCR. D Levels of HBx expression and NLRP3, ASC, Caspase-1, GSDMD, and IL-1β proteins were detected by WB. E The activity of caspase-1 related to pyroptosis was quantified by ELISA. F Representative images showing co-localization of GSDMD-N (red) and Dio (green) were captured by confocal microscopy (Left). Scale bar, 10 µm. Quantification of the relative intensity of GSDMD-N/Dio is shown in a bar graph (Right). GI Levels of LDH (G), IL-1β (H), and IL-18 (I) in supernatants. J Global RNA m6A levels in cells were measured by colorimetric assays. K Relative mRNA levels of METTL3, METTL14, and WTAP were detected by qRT-PCR. L Expression levels of METTL3, METTL14, and WTAP proteins were detected by WB. (M-N) A liver transcriptome dataset (GSE89632) was derived from NASH patients (n = 19) and healthy controls (HC, n = 24). M Correlation analysis between methyltransferase-related genes and inflammation- or lipid metabolism-related genes. N GSEA was performed. Data are presented as mean ± SD. *, P < 0.05, compared to the control group.
Fig. 3
Fig. 3. METTL3 targets NLRP3 mRNA to mediate pyroptosis in HBx-expressing HepG2 cells.
AE HepG2 cells were transfected with pcDNA3.1-HBx (1 μg/mL, 24 h) to construct the HBx-expressing hepatocytes, followed by treatment with or without CY-09 (10 μM, 24 h), while CY-09 was used as a specific inhibitor of NLRP3 activity. A Expression levels of NLRP3, ASC, Caspase-1, GSDMD, and IL-1β proteins were detected by WB. B Representative IF images showing co-localization of GSDMD-N (red) and Dio (green) were captured by confocal microscopy (Left). Scale bar, 10 µm. Quantification of the relative intensity of GSDMD-N/Dio is shown in a bar graph (Right). CE Levels of LDH (C), IL-1β (D), and IL-18 (E) in supernatants. FL HBx-expressing HepG2 cells were transfected with shMETTL3 (1 μg/mL, 24 h) to knock down METTL3, while shNC was transfected as a negative control. F Levels of METTL3 mRNA and METTL3 protein in cells knocked down by serial shMETTL3 (#1-#3). G The level of NLRP3 mRNA was detected. H Expression levels of METTL3, NLRP3, and pyroptosis-related proteins. I Representative IF images showing co-localization of GSDMD-N (red) and Dio (green) in cells (Left), while the quantification is shown in a bar graph (Right). Scale bar, 10 µm. JL Levels of LDH (J), IL-1β (K), and IL-18 (L) in supernatants. MO A pB-METTL3 recombinant plasmid was constructed and transfected to construct the stable METTL3 overexpression (OE) in HepG2 cells, while pB-NC was used as a control. M Levels of METTL3 mRNA and METTL3 protein in cells. N The level of NLRP3 mRNA was detected. O Expression levels of NLRP3 and pyroptosis-related proteins in cells. PU METTL3-overexpressing HepG2 cells were pre-treated with or without CY-09 (10 μM, 24 h) to inhibit NLRP3 activity. P Expression levels of METTL3, NLRP3, and pyroptosis-related proteins. Q Representative images showing the flow cytometry quantification of caspase-1 activity related to pyroptosis. R Representative IF images showing co-localization of GSDMD-N (red) and Dio (green) (Upper), while the quantification is shown in a bar graph (Lower). Scale bar, 10 µm. SU Levels of LDH (S), IL-1β (T), and IL-18 (U) in supernatants. Data are presented as mean ± SD. *, P < 0.05, compared to the control group. #, P < 0.05, compared to the corresponding group.
Fig. 4
Fig. 4. METTL3-targeting function regulates NLRP3 mRNA stability in an A2748 site m6A-dependent manner in HBx-expressing HepG2 cells.
AE HepG2 cells were transfected with pcDNA3.1-HBx (1 μg/ml, 24 h) to construct HBx-expressing hepatocytes, while the negative control (NC) cells transfected with pcDNA3.1 vector served as controls. A The mRNA stability assay for half-life of NLRP3 mRNA transcript was measured by qRT-PCR in cells treated with actinomycin D (ActD, 5 μg/ml) at the indicated time points. B Representative FISH images showing the staining of METTL3 (green) and NLRP3 mRNA (red) in cells, while DAPI (blue) was used to counterstain the nuclei. Scale bar, 20 µm. C RIP-qPCR analysis of NLRP3 mRNA illustrating the binding interaction between NLRP3 mRNA and METTL3. D MeRIP-qPCR analysis of m6A levels on NLRP3 mRNA. E RNA pulldown assay using an NLRP3 mRNA probe followed by detection of METTL3 protein by WB. FI Stable METTL3-overexpressing HepG2 cells were generated using recombinant plasmids encoding wild-type (METTL3-WT) or a catalytically inactive mutant (DWWP to AWWA) (METTL3-MUT). F Representative FISH images showing the staining of NLRP3 mRNA (red) and DAPI (blue) in cells. Scale bar, 20 µm. G Half-life of NLRP3 mRNA transcript was measured by the mRNA stability assay. H RIP-qPCR analysis of NLRP3 mRNA illustrating the binding interaction between NLRP3 mRNA and METTL3. I MeRIP-qPCR analysis of m6A levels on NLRP3 mRNA. J RNA pulldown assay using an NLRP3 mRNA probe followed by detection of METTL3 protein by WB. K, L pmirGLO-NLRP3-5′UTR, -CDS, and -3′UTR reporter gene recombinant plasmids were constructed by inserting the corresponding fragments of NLRP3 mRNA (K), followed by transfection into METTL3-WT-overexpressing HepG2 cells (L). L Relative luciferase activities of the reporters were detected in cells. M Based on the online databases, including SRAMP, BERMP, and RMBase V2.0, a Venn plot shows the predicted m6A modification sites in NLRP3 mRNA. NQ pmirGLO-NLRP3-WT, -MUT(C2026), -MUT(C2706), and -MUT(C2748) luciferase reporter gene recombinant plasmids were constructed by inserting WT or site-directed mutant (MUT) NLRP3 CDS fragments (N), followed by transfection into cells. O Relative luciferase activities of NLRP3-WT and -MUT luciferase reporters in NC or METTL3-WT-overexpressing HepG2 cells. P Relative luciferase activities of NLRP3-WT or -MUT(C2748) luciferase reporters in NC, METTL3-WT-, and METTL3-MUT-overexpressing HepG2 cells. Q Relative luciferase activities of NLRP3-WT or -MUT(C2748) luciferase reporters in HBx-expressing HepG2 cells. Data are presented as mean ± SD, n = 3. *, P < 0.05, compared to the control group. #, P < 0.05, compared to the corresponding group.
Fig. 5
Fig. 5. HBx-induced B56α-interacting METTL3 increases NLRP3 mRNA m6A levels to mediate pyroptosis in HepG2 cells.
AC METTL3-overexpressing 293 T cells were constructed, followed by protein extraction and subjection to the Co-IP mass spectrometry (MS) assay (A). B GO enrichment analysis was performed on the identified METTL3-interacting proteins. C Potential protein interactions between PP2A B-subunits and METTL3 were identified. D The GSE89632 dataset, derived from NASH patients (n = 19) and healthy controls (HC, n = 24), was used for correlation analysis between METTL3 and the four PP2A subunit genes. E, F Co-IP analyses were conducted using anti-METTL3 (E) and anti-B56α (F) antibodies to assess the binding interaction between METTL3 and B56α in HepG2 cells transfected with or without pcDNA3.1-HBx plasmid (1 μg/mL, 24 h). G Molecular docking images showing the predicted interaction between METTL3 and B56α using HDOCK (http://hdock.phys.hust.edu.cn/). H HepG2 cells overexpressing B56α (B56α-OE) or METTL3-WT were constructed. Co-IP analysis showing the binding interaction between endogenous METTL3 and B56α proteins. I HepG2 cells were co-transfected with Flag-METTL3 and HA-B56α recombinant plasmids for 24 h, followed by subjecting the cell extracts to Co-IP analysis. The binding interaction between exogenous Flag-METTL3 and HA-B56α fusion proteins was detected by WB with anti-HA and anti-Flag antibodies. J Representative images showing co-localization of B56α (green) and METTL3 (red) were captured by confocal microscopy in B56α-OE HepG2 cells, while DAPI (blue) was used to counterstain the nuclei. Scale bar, 10 µm. K, L Recombinant plasmids (based on PB513B-1 vector) expressing Flag-METTL3 fusion proteins with corresponding fragments, including Flag-METTL3-F#1 to -F#7 (K), were transfected into HepG2 cells (1 μg/mL, 24 h). L Co-IP analysis showing the binding interactions between the fragments of Flag-METTL3 fusion proteins and B56α protein. MO HBx-expressing HepG2 cells were transfected with shPPP2R5A (1 μg/mL, 24 h) to knock down B56α expression, while shNC was used as a negative control. The release levels of LDH (M), IL-1β (N), and IL-18 (O) in supernatants were detected. PW B56α-OE HepG2 cells were treated with STM2457 (20 μM, 24 h) to inhibit m6A catalytic activity of METTL3. P Global RNA m6A levels in cells was measured. Q The level of NLRP3 mRNA was detected by RT-qPCR. R NLRP3 mRNA m6A levels were detected by MeRIP-qPCR using an anti-m6A antibody. S Representative FISH images showing co-localization of METTL3 (green) and NLRP3 mRNA (red), while DAPI was used to counterstain the nuclei. Scale bar, 10 µm. T Expression levels of NLRP3, ASC, Caspase-1, GSDMD, and IL-1β proteins were detected by WB. UW The release levels of LDH (U), IL-1β (V), and IL-18 (W) in supernatants were detected. Data are presented as mean ± SD, n = 3. *, P < 0.05, compared to the control group. #, P < 0.05, compared to the corresponding group.
Fig. 6
Fig. 6. HBx-induced pyroptosis and lipotoxicity are suppressed by STM2457-mediated inhibition of METTL3 in HBx-expressing HepG2 cells.
HBx-expressing HepG2 cells were treated with STM2457 (20 μM, 24 h). A Global RNA m6A levels in cells were measured. B NLRP3 mRNA levels were detected by qRT-PCR. C The mRNA stability assay for half-life of NLRP3 mRNA transcript was measured by qRT-PCR in cells treated with actinomycin D (ActD, 5 μg/ml) at the indicated time points. D Expression levels of NLRP3, ASC, Caspase-1, GSDMD, and IL-1β proteins were detected by WB. E Representative IF images showing co-localization of GSDMD-N (red) and Dio (green) were captured by confocal microscopy (Left). Scale bar, 10 µm. Quantification of the relative intensity of GSDMD-N/Dio is shown in a bar graph (Right). FH The release levels of LDH (F), IL-1β (G), and IL-18 (H) in supernatants were detected. I Representative images showing Oil red O staining (Scale bar, 100 μm) and IF staining of LD (Scale bar, 10 μm) in cells. J, K The levels of TC (J) and TG (K) in cells were detected. Data are presented as mean ± SD, n = 3. *, P < 0.05, compared to the control group. #, P < 0.05, compared to the corresponding group.
Fig. 7
Fig. 7. METTL3 intervention by STM2457 alleviates NLRP3-dependent MASH in HBx-Tg mice in vivo.
HBx-Tg mice were used to construct the MASH model, and MCD-fed mice served as the positive model. Mice revived daily intraperitoneal injection of STM2457 (50 mg•kg−1 BW) for two weeks, while wild-type mice served as the negative control. n = 5 per group. A Global RNA m6A levels in livers were measured by colorimetric assays. B RIP-qPCR analysis of NLRP3 mRNA in livers illustrating the binding interaction between NLRP3 mRNA and METTL3 using anti-METTL3 antibody. C MeRIP-qPCR analysis of m6A levels on NLRP3 mRNA in livers using anti-m6A antibody. D Relative mRNA levels of NLRP3 and pyroptosis-related genes in livers were detected by qRT-PCR. E, F Expression levels of NLRP3, ASC, Caspase-1, GSDMD, and IL-1β proteins in livers were detected by WB. (G) Representative IHC staining images showing NLRP3 protein expression in liver tissues. Scale bar, 100 μm. H, I Levels of serum IL-1β (H) and IL-18 (I) were detected. J, K Levels of serum ALT (J) and AST (K) were detected. L, M Levels of TC (L) and TG (M) in livers were detected. N Representative images showing H&E, Oil red O, and Masson staining in liver tissues. Scale bar, 100 μm. Black arrows indicate inflammatory foci. O MASH score analysis is shown in a bar graph. Data are presented as mean ± SD, n = 3. *, P < 0.05, compared to the control group. #, P < 0.05, compared to the corresponding group.

References

    1. Riazi K, Azhari H, Charette JH, Underwood FE, King JA, Afshar EE, et al. The prevalence and incidence of NAFLD worldwide: a systematic review and meta-analysis. Lancet Gastroenterol Hepatol. 2022;7:851–61. - PubMed
    1. Targher G, Byrne CD, Tilg H. MASLD: a systemic metabolic disorder with cardiovascular and malignant complications. Gut. 2024;73:691–702. - PubMed
    1. Nie Q, Luo X, Wang K, Ding Y, Jia S, Zhao Q, et al. Gut symbionts alleviate MASH through a secondary bile acid biosynthetic pathway. Cell. 2024;187:2717–34 e33. - PubMed
    1. Wang YF, Zhang WL, Li ZX, Liu Y, Tan J, Yin HZ, et al. METTL14 downregulation drives S100A4(+) monocyte-derived macrophages via MyD88/NF-kappaB pathway to promote MAFLD progression. Signal Transduct Target Ther. 2024;9:91. - PMC - PubMed
    1. Bansal SK, Bansal MB. Pathogenesis of MASLD and MASH - role of insulin resistance and lipotoxicity. Aliment Pharm Ther. 2024;59:S10–S22. - PubMed

MeSH terms

LinkOut - more resources