. 2025 Oct 6;16(1):8876.
doi: 10.1038/s41467-025-63948-4.

Neutralizing and binding antibodies are a correlate of risk of COVID-19 in the CoVPN 3008 study in people with HIV

Nonhlanhla N Mkhize #  1   2 Bo Zhang #  3 Caroline Brackett #  4 Peter James Elyanu  5 Asa Tapley  3   6   7 Sufia Dadabhai  8 Jiani Hu  3 Bich T N Do  4 Daniel J Schuster  4 Jack Heptinstall  4 Sheetal Sawant  4 Kelly Seaton  4 Marcella Sarzotti-Kelsoe  4 Aaron Hudson  3   9   10 Yutong Jin  3 Sinethemba Bhebhe  1   2 Haajira Kaldine  1   2 Prudence Kgagudi  1   2 Tandile Modise  1   2 Nyaradzo M Mgodi  11 Jessica Andriesen  3 April K Randhawa  3 Leigh H Fisher  3 Jia Jin Kee  3 Craig A Magaret  3 James Peng  9 Avi Kenny  12   13 Lindsay N Carpp  3 Zhe Chen  14 Siyu Heng  15 Manuel Villaran  3 Azwidihwi Takalani  16 Bert Le Roux  16 Eduan Wilkinson  17   18 Jackline Odhiambo  3   16 Parth Shah  10 Laura Polakowski  19 Margaret Yacovone  19 Taraz Samandari  20 Zvavahera Chirenje  11 Joseph Makhema  21 Ethel Kamuti  22 Katanekwa Njekwa  22 Harriet Nuwagaba-Biribonwoha  23   24 Allan Baguma  5 Sharlaa Badal-Faesen  25 William Brumskine  26 Soritha Coetzer  27 Rodney Dawson  28 Sinead Delany-Moretlwe  29 Andreas Henri Diacon  30 Samantha Fry  31 Katherine Gill  32 Anda Madikida  32 Zaheer Ahmed Ebrahim Hoosain  33 Mina C Hosseinipour  34   35 Mubiana Inambao  36 Craig Innes  37 Steve Innes  32 Dishiki Kalonji  38 Humphrey Mwape  39 Priya Kassim  40 Melvin C Kamanga  41 William Kilembe  42 Fatima Laher  43 Mookho Malahleha  44 Vongane Louisa Maluleke  45 Grace Mboya  46 Philister Adhiambo Madiega  47 Kirsten McHarry  48 Essack Mitha  49 Yajna Duki  50 Pamela Mda  51 Moroesi Moerane  51 Tumelo Moloantoa  52 Simpson Nuwamanya  53 Sharana Mahomed  54 Vimla Naicker  55 Anusha Nana  40 Annet Nanvubya  56 Barbarah Kawoozo  56 Maphoshane Nchabeleng  57 Walter Otieno  58   59 Elsje Louise Potgieter  60 Disebo Potloane  54 Zelda Punt  61 Jamil Said  62 Yashna Singh  32 Sheetal Kassim  32 Dorothie van der Vendt  32 Mohammed Siddique Tayob  63 Yacoob Vahed  64 Deo Ogema Wabwire  65 James G Kublin  3 Linda-Gail Bekker  32 Lawrence Corey  3 Glenda E Gray  66 Yunda Huang  3   67 Philip Kotze  68 Nigel Garrett  32   54   69 John Hural  3 Guido Ferrari  4 Erica Andersen-Nissen  3   70 David Montefiori  4 Penny L Moore  1   2   54 M Juliana McElrath  3 Georgia D Tomaras  71 Peter B Gilbert  72   73   74 CoVPN 3008 Study Team
Affiliations

Neutralizing and binding antibodies are a correlate of risk of COVID-19 in the CoVPN 3008 study in people with HIV

Nonhlanhla N Mkhize et al. Nat Commun. .

Abstract

People with HIV (PWH) are understudied in COVID-19 vaccine trials, leaving knowledge gaps on whether the identified immune correlates of protection also hold in PWH. CoVPN 3008 (NCT05168813) enrolled predominantly PWH and reported lower COVID-19 incidence for a Hybrid vs. Vaccine Group (baseline SARS-CoV-2-positive and one mRNA-1273 dose vs. negative and two doses). Using case-cohort sampling, antibody markers at enrolment (M0) and four weeks post-final vaccination (Peak) are assessed as immune correlates of COVID-19. For the Hybrid Group [n = 287 (195 PWH)], all M0 markers inversely correlate with COVID-19 through 230 days post-Peak, with 50% inhibitory dilution BA.4/5 neutralizing antibody titer (nAb-ID50 BA.4/5) the strongest and only independent correlate (HR per 10-fold increase=0.46, 95% CI 0.28, 0.75; P = 0.002). For the Vaccine Group [n = 115 (86 PWH)], Peak nAb-ID50 BA.4/5 correlates with reduced COVID-19 risk (1.9%, 1.1%, and 0.3% at titers 10, 100, and 1000 AU/ml) through 92, but not 165, days post-Peak. Using multivariable Cox analysis of binding and nAb, nAb titers predict COVID-19 in PWH. Two doses of a 100-µg Ancestral strain mRNA vaccine in baseline-SARS-CoV-2-negative individuals elicit sufficient cross-reacting Omicron antibodies to reduce COVID-19 incidence for 90 days post-Peak, but viral evolution and waning antibodies abrogate this protection thereafter.


Conflict of interest statement

Competing interests: L.N.C. was compensated for work on this manuscript through a consulting agreement with Fred Hutchinson Cancer Center. L.C., F.L., S.B.-F., S.D.-M., M.C.H., C.A.M., E.A.-N., Y.H., M.J.M., G.M., N.M.M., P.L.M., and J.A. received funding from NIAID/NIH paid to their institutions. S.D. reports salary support from Johns Hopkins University. M.J.M. reports NIAID and Bill & Melinda Gates Foundation payments to her institution and payment from Stanford, CROI, NIH VRC, and the Ragon Institute. P.B.G. received funds from NIAID/NIH paid to his institution, consulting fees from Curevo Vaccine Company and MinervaX Vaccine Company, served unpaid on a Moderna Advisory Board for Zika vaccines, and received contracts to his institution for AstraZeneca Vaccine SAB, Sanofi SAB, and Vaccine Company SAB. All other authors have nothing to declare.

Figures

Fig. 1
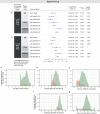
Fig. 1. Distribution of antibody response markers at M0 and at Peak in the four participant groups defined by (Hybrid Group, Vaccine Group) cross-classified with (PWH, PWoH). The cohorts are random samples from the four groups, comprising the Serum-RIS.
a, b IgG N Index; c, d IgG Spike BA.4/5; e, f nAb-ID50 BA.4/5. Violin plots contain interior box plots with upper and lower horizontal edges representing the 25th and 75th percentiles of antibody level and middle line representing the 50th percentile. Vertical bars represent the distance from the 25th (or 75th) percentile of antibody level and the minimum (or maximum) antibody level within the 25th (or 75th) percentile of antibody level minus (or plus) 1.5 times the interquartile range. Each side shows a rotated probability density of the data. Covariate-adjusted, mean titer level (in the log10-scale) with 95% confidence intervals and two-sided P-values based on non-parametric bootstrap (see Methods for details of how the bootstrapped p-values were obtained based on g-computation) are given above violin boxplots. Analyses adjusted for HIV status at baseline, age, sex, and BMI (for M0 comparisons of Hybrid Group vs. Vaccine Group and for Peak comparisons of Hybrid Group vs. Vaccine Group); age, sex, and BMI (for M0 comparisons of Hybrid PWH vs. Hybrid PWoH, Peak comparisons of Hybrid PWH vs. Hybrid PWoH, and Peak comparisons of Vaccine PWH vs. Vaccine PWoH). M0 Vaccine PWH and Vaccine PWoH GMVs and 95% CIs shown were also adjusted by age, sex, and BMI. No adjustment was made for multiple comparisons. Peak, 4 weeks post last vaccine dose (M1, Hybrid Group; M2, Vaccine Group). N Nucleocapsid protein, nAb-ID50 50% inhibitory serum dilution neutralizing antibody, PWH people with HIV, PWoH people without HIV, RIS random immunogenicity subset.
Fig. 2
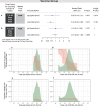
Fig. 2. Antibody response levels at M0 or at Peak by COVID-19 outcome status.
Data points are from eligible COVID-19 cases and non-cases in the Per-protocol Serum Immunogenicity Analysis Set. The plots show immune markers for which correlates of risk are assessed. Plots are shown for ac, e, f Hybrid Group or d, g Vaccine Group levels of a IgG N Index at M0; b IgG Spike BA.4/5 at M0; c, d IgG Spike BA.4/5 at Peak; e nAb-ID50 BA.4/5 at M0; and f, g nAb-ID50 BA.4/5 at Peak. The violin plots contain interior box plots with upper and lower horizontal edges representing the 25th and 75th percentiles of antibody level and middle line representing the 50th percentile. The vertical bars represent the distance from the 25th (or 75th) percentile of antibody level and the minimum (or maximum) antibody level within the 25th (or 75th) percentile of antibody level minus (or plus) 1.5 times the interquartile range. Each side shows a rotated probability density (estimated by a kernel density estimator with a default Gaussian kernel) of the data. Positive response at M0 and vaccine-response at Peak for each antibody marker is defined in Table 1. Cases acquired a COVID-19 endpoint 7 days post Peak through 92 days post Peak or 93 days post Peak through 230 days post Peak, as designated in the key at the bottom of each panel. Non-cases did not have a positive RT-PCR result at the Peak visit and did not acquire a COVID-19 endpoint after M0 up to the date by which the last enrolled participant reached 230 days post Peak (March 31, 2023). Peak, 4 weeks post last vaccine dose (M1 for Hybrid Group, M2 for Vaccine Group). The frequency of COVID-19 endpoints through 230 days post Peak that were BA.4 or BA.5 was 46.6% for Hybrid and 30.0% for Vaccine (Fig. 4a in ref. ). N, Nucleocapsid protein; nAb-ID50, 50% inhibitory serum dilution neutralizing antibody; PWH, people with HIV. PWoH, people without HIV.
Fig. 3
Fig. 3. Correlate of risk analyses in the Hybrid Group.
Analyses used eligible COVID-19 cases and non-cases in the Per-protocol Serum Immunogenicity Analysis Set in the Hybrid Group (N = 287). a, b Covariate-adjusted hazard ratios (HRs) of COVID-19 [follow-up: a 7 to 92 days post-Peak; b 7 to 230 days post-Peak] per 10-fold increase in immune marker at M0, at Peak, or for Peak/M0 fold-rise. Blue squares are point estimates and horizontal lines are 95% confidence intervals. P-values are from a two-sided Wald test. Holm-Bonferroni family-wise error rate (FWER) adjusted two-sided p-values are also shown. Cases acquired a COVID-19 endpoint a 7 through 92 days post-Peak or b 7 through 230 days post-Peak. HRs were estimated using inverse probability sampling weighted Cox regression models; 95% confidence intervals (CIs) and Wald-based p-values are shown. Analyses adjusted for: a HIV status and baseline risk score; b whether enrolled in South Africa, HIV status, TB status, enrolment period, and baseline risk score. c–g Controlled risk plots for Hybrid Group (N = 287) antibody markers at M0 and Peak. Covariate-adjusted probability of COVID-19 over 165 days post-Peak is estimated under hypothetical assignments of all participants to the Hybrid Group and the marker value on the x-axis. c M0 IgG N Index concentration, d M0 IgG Spike BA.4/5 concentration, e M0 nAb ID50 BA.4/5 titer, f Peak IgG Spike BA.4/5 concentration, g Peak nAb ID50 BA.4/5 titer. Controlled risk was estimated using a monotone-constrained nonparametric method with covariate adjustment and restricted to the middle 95% quantiles of available data. Solid lines indicate point estimates; dotted lines and shading indicate pointwise 95% CIs. Horizontal gray lines: overall cumulative incidence of COVID-19 from 7 to 165 days post-Peak in the Hybrid Group. Background kernel density plots show marker distributions at M0 or at Peak. Analyses adjusted for whether enrolled in South Africa, HIV status, TB status, enrolment period, and baseline risk score. AU, arbitrary units; FWER, family-wise error rate adjusted p-value; N, Nucleocapsid protein; nAb-ID50, 50% inhibitory serum dilution neutralizing antibody titer; Peak, 4 weeks post-last dose (M1 for Hybrid Group).
Fig. 4
Fig. 4. Correlate of risk analyses in the Vaccine Group for antibodies measured at Peak.
Analyses used eligible COVID-19 cases and non-cases in the Per-protocol Serum Immunogenicity Analysis Set in the Vaccine Group (N = 115). a, b Covariate-adjusted hazard ratios (HRs) of COVID-19 [follow-up: a 7 to 92 days post-Peak; b 7 to 230 days-post Peak] per 10-fold Peak immune marker increase. Blue squares are point estimates and horizontal lines are 95% confidence intervals. P-values are from a two-sided Wald test. Holm-Bonferroni family-wise error rate (FWER) adjusted two-sided p-values are also shown. Cases acquired a COVID-19 endpoint a 7 through 92 days post Peak or b 7 through 230 days post Peak. HRs were estimated using inverse probability sampling weighted Cox regression models; 95% confidence intervals (CIs) and two-sided Wald-based p-values are shown. Analyses adjusted for: a HIV status and baseline risk score; b whether enrolled in South Africa, HIV status, TB status, enrolment period, and baseline risk score. c–f Controlled risk plots for Vaccine Group (N = 115) antibody markers at Peak. Covariate-adjusted probability of COVID-19 by c, d 92 days post Peak or e, f 165 days post-Peak is estimated under hypothetical assignments of all participants to the Vaccine Group and the marker value on the x-axis. c, e Peak IgG Spike BA.4/5 concentration; d, f Peak nAb ID50 BA.4/5 titer. Controlled risk was estimated using a monotone-constrained nonparametric method with covariate adjustment and restricted to the middle 95% quantiles of the available marker data. Solid lines indicate point estimates; dotted lines and shading indicate pointwise 95% CIs. Horizontal gray lines: overall cumulative incidence of COVID-19 from 7 to 92 (or 165) days post-Peak in the Vaccine Group. Background kernel density plots show marker distributions at M0 or at Peak. Analyses adjusted for whether enrolled in South Africa, HIV status, TB status, enrolment period, and baseline risk score. AU, arbitrary units; FWER, family-wise error rate adjusted p-value; N, Nucleocapsid protein; nAb-ID50, 50% inhibitory serum dilution neutralizing antibody titer; Peak, 4 weeks post-last vaccine dose (M2 for Vaccine Group).
Fig. 5
Fig. 5. Stochastic-thresholded relative risk CoP analysis.
Plots show relative risk of COVID-19 through 160 days post-Peak for the Hybrid Group with thresholded antibody marker a M0 IgG N Index concentration, b M0 IgG Spike BA.5 concentration, c M0 nAb ID50 BA.4/5 titer, d Peak IgG Spike BA.4/5 concentration, e Peak nAb ID50 BA.4/5 titer vs. overall risk of the Vaccine Group. Relative risk is the covariate-adjusted thresholded cumulative incidence in Hybrid Group participants divided by the covariate-adjusted cumulative incidence in the Vaccine Group. Each black dot (threshold value) represents a point estimate of relative risk (compared to the entire Vaccine Group) of COVID-19 through 160 days post-Peak for Hybrid Group participants if their marker levels were as high as or higher than that given threshold value. The grid of thresholds was created by segmenting the marker values at COVID-19 endpoints into increments of 0.1. This grid spans from the minimum marker value to the highest value for which there are at least 3 COVID-19 endpoints with a marker value at or above that value. The solid black lines linearly interpolate the grid points. The blue dots represent the marker values of Hybrid Group participants who had a COVID-19 endpoint through 160 days post-Peak, overlaid on the black line. The vertical red dashed line is the antibody marker threshold above which no COVID-19 endpoints occurred in the Hybrid Group through 160 days post-Peak. The gray shaded area indicates pointwise 95% CIs. The estimates and CIs were adjusted using the assumption that the true threshold-response relative risk is non-decreasing. The upper boundary of the green shaded area is the estimate of the reverse cumulative distribution function (CDF) of the marker in Hybrid Group participants. Analyses adjusted for whether enrolled in South Africa, HIV status, and baseline risk score. Data points are from eligible COVID-19 cases and non-cases in the Per-protocol Serum Immunogenicity Analysis Set. nAb-ID50, 50% inhibitory serum dilution neutralizing antibody titer. Peak, 4 weeks post last vaccine dose (M1 for Hybrid Group). CI, confidence interval; CoP, correlate of protection.
Fig. 6
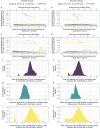
Fig. 6. Comparison of controlled risk curves between the CoVPN 3008 study (recipients of one or two doses of mRNA-1273, depending on history of prior infection), the COVAIL study (data shown here are restricted to recipients of a second one-dose mRNA-1273 boost), and the COVE study (recipients of a third mRNA-1273 dose), separately in the Hybrid and Vaccine Groups.
a–d Controlled risk of COVID-19 through a, b 92 days post-Peak or c, d 165 days post-Peak for a, c Hybrid Group and b, d Vaccine Group participants, by Peak neutralizing antibody ID50 titer (in AU/ml) against the dominantly circulating variant (CoVPN 3008: BA.4/5, COVAIL BA.4/5, COVE Booster: BA.1). For each trial, Peak is: CoVPN 3008 – 4 weeks post-last dose (M1 for Hybrid Group, M2 for Vaccine Group); COVAIL – 2 weeks post-second boost; COVE – 28 days post-third dose. Hybrid vs. Vaccine is defined by SARS-CoV-2 positive vs. negative at first dose (CoVPN 3008), second boost post-primary series (COVAIL), or third dose (COVE). For COVE, all participants received three mRNA-1273 doses; for COVAIL, all participants received mRNA-1273 as their second booster dose. Controlled risk was estimated using a monotone-constrained nonparametric method with covariate adjustment and restricted to the middle 90% quantiles of the available marker data. Background kernel density plots are estimates of the distribution of the time-to-COVID-19 in days since Peak (a, b 7 to 92 days; c, d 7 to 165 days). e–j Estimates (kernel density plots) of Peak neutralizing antibody distribution against the circulating strain in the respective analysis population. Analyses adjusted for: COVAIL, force of infection score and baseline risk score; COVE, baseline risk score, at risk status, and community of color status; CoVPN 3008, whether enrolled in South Africa, HIV status, TB status, enrolment period, and baseline risk score. Study endpoint lineages and timeframes were: COVE, BA.1, December 1, 2021 to April 5, 2022; COVAIL, several Omicron sub-lineages, May 30, 2022 to November 28, 2022; CoVPN 3008, several Omicron sub-lineages, April 26, 2022 to February 7, 2023 (pooling over Hybrid and Vaccine groups). AU/ml, arbitrary units/ml; nAb, neutralizing antibody; ID50, 50% inhibitory serum dilution titer.

References

    1. Garrett, N. et al. Hybrid versus vaccine immunity of mRNA-1273 among people living with HIV in East and Southern Africa: a prospective cohort analysis from the multicentre CoVPN 3008 (Ubuntu) study. eClinicalMedicine80, 103054 (2025). - PMC - PubMed
    1. Hoft, M. A., Burgers, W. A. & Riou, C. The immune response to SARS-CoV-2 in people with HIV. Cell Mol. Immunol.21, 184–196 (2024). - PMC - PubMed
    1. El Chaer, F. & El Sahly, H. M. Vaccination in the adult patient infected with HIV: a review of vaccine efficacy and immunogenicity. Am. J. Med132, 437–446 (2019). - PubMed
    1. Kerneis, S. et al. Long-term immune responses to vaccination in HIV-infected patients: a systematic review and meta-analysis. Clin. Infect. Dis.58, 1130–1139 (2014). - PMC - PubMed
    1. Schuster, D. J. et al. Lower SARS-CoV-2-specific humoral immunity in people living with HIV-1 recovered from nonhospitalized COVID-19. JCI Insight7, 10.1172/jci.insight.158402 (2022). - PMC - PubMed

MeSH terms