. 2025 Oct 6;16(1):8873.
doi: 10.1038/s41467-025-63905-1.

Adipocyte FMO3-derived TMAO induces WAT dysfunction and metabolic disorders by promoting inflammasome activation in ageing

Affiliations

Adipocyte FMO3-derived TMAO induces WAT dysfunction and metabolic disorders by promoting inflammasome activation in ageing

Thashma Ganapathy et al. Nat Commun. .

Abstract

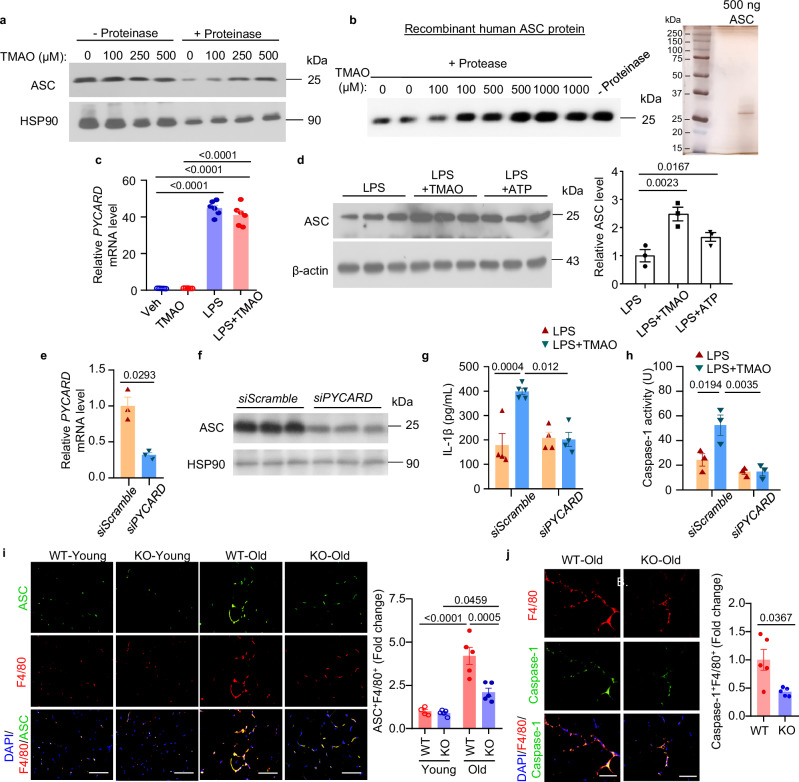
Trimethylamine N-oxide (TMAO) contributes to cardio-metabolic diseases, with hepatic flavin-containing monooxygenase 3 (FMO3) recognized as its primary source. Here we demonstrate that elevated adipocyte FMO3 and its derived TMAO trigger white adipose tissue (WAT) dysfunction and its related metabolic disorders in ageing. In adipocytes, ageing or p53 activation upregulates FMO3 and TMAO levels. Adipocyte-specific ablation of FMO3 attenuates TMAO accumulation in WAT and circulation, leading to enhanced glucose metabolism and energy and lipid homeostasis in ageing and obese mice. These improvements are associated with reduced senescence, fibrosis and inflammation in WAT. Proteomics analysis identified TMAO-interacting proteins involved in inflammasome activation in adipocytes and macrophages. Mechanistically, TMAO binds to the central inflammasome adaptor protein ASC, promoting caspase-1 activation and interleukin-1β production. Our findings uncover a pivotal role for adipocyte FMO3 in modulating TMAO production and WAT dysfunction by promoting inflammasome activation in ageing via an autocrine and paracrine manner.


Conflict of interest statement

Competing interests: The authors declare no conflicts of interest.

Figures

Fig. 1
Fig. 1. Mature adipocytes produce TMAO via FMO3.
af 8-week-old male and female C57BL/6 mice were used. qPCR (a) and immunoblotting (b) analyses of FMO3 expression in subcutaneous white adipose tissue (sWAT), epididymal white adipose tissue (eWAT), brown adipose tissue (BAT) and the liver. Relative FMO3 expression is normalized to that in eWAT of male mice. Densitometry analysis of FMO3 normalized with HSP90 is shown in (b). a: n = 5 for male; n = 7 for female. b: n = 4. cf d9-TMAO production after incubating eWAT, sWAT and BAT explants and primary hepatocytes (HCs), with d9-TMA (200 μM or 500 μM) for 48 h. Levels in tissue lysates were normalized to total protein concentration. sWAT: n = 5 (c and e); n = 6 (d and f). eWAT: n = 4 (c and e, males), and n = 6 in remaining panels. BAT: n = 4 (f, males), and n = 6 in other panels. Hepatocytes: n = 3. g Immunoblotting analysis of FMO3. n = 4. h 3T3-L1 cells were differentiated into mature adipocytes, followed by immunoblotting analysis of FMO3, adiponectin (APN; adipocyte marker) and HSP90. The day before differentiation is day 0. Equal amounts of liver lysate were loaded as the positive control of FMO3. n = 2. i, j Mature adipocytes or stromal vascular fraction (SVF) from eWAT (i), and undifferentiated 3T3-L1 fibroblasts (preadipocytes) or differentiated 3T3-L1 adipocytes (j) were incubated with 100 μM d9-TMA for 24 h, followed by d9-TMAO measurement in the cell lysate. i: n = 4. j: n = 3. k, l 3T3-L1 mature adipocytes transfected with siRNA against Fmo3 (siFmo3) or scramble control (siScramble) for 48 h, were subjected to immunoblotting analysis of FMO3 (k) and d9-TMAO detection as indicated (l). n = 3. m, n Matured adipocytes differentiated from SVF of sWAT of 6-week-old adipocyte-FMO3 knock-out (KO) mice and their wild-type (WT) littermates were used. m Immunoblotting and respective densitometry analyses of FMO3 normalized with β-actin. n = 4. n d9-TMAO levels measured as indicated. n = 4. Data represented as mean ± SEM. Significance was calculated using one-way ANOVA for (af) and two-tailed Student’s t-test for (g, h, k, ln), with Welch’s correction for (i and j).
Fig. 2
Fig. 2. FMO3 and TMAO are upregulated in WAT during natural ageing.
a FMO3 expression in various tissues of 1-month-old (so-called “Young”, n = 6), 27-months-old (so-called “Old”, n = 4) and between these two time points from RNA-sequencing data of Mus musculus with accession number GSE132040. Liver: n = 17 for 0–6 M, n = 12 for 7–12 M and 13-18 M, and n = 14 for 19–27 M. bg 3-month-old (Young) and 24-month-old (Old) male C57BL/6 J mice were used. bd Immunoblotting analysis of FMO3 expression in eWAT, sWAT, BAT and liver. Densitometry analysis of FMO3 normalized with HSP90 is shown in (d). n = 4 for sWAT, eWAT, and BAT. n = 3 for liver. e Circulating levels of TMAO and choline. n = 5 for young. n = 4 for old. f TMAO level in the liver, eWAT and BAT as indicated. TMAO level is normalized with total protein concentration. n = 5 for liver and BAT. n = 3 for young and n = 5 for old in eWAT. g sWAT explants were incubated with 200 μM d9-TMA for 48 h, followed by d9-TMAO detection in tissue lysate. d9-TMAO level is normalized with total protein concentration. n = 3. h FMO3 expression in sWAT of 20–35 years old (so-called “Young”) and 60-85 years old (so-called “Old Aged”) from RNA-sequencing data of human subjects with accession number GSE175495. n = 12. i, j “Young” is defined as ages 16-46 years old (n = 6) and “Old Aged” as age ≥ 60 years old (n = 8) obtained from non-diabetes patients with nonfunctional adrenal adenoma who underwent adrenalectomy or partial adrenalectomy. i TMAO level in human sWAT. n = 14. j Pearson correlation analysis of TMAO level in sWAT and age. n = 14. k FMO3 expression in sWAT of humans after 1 and 2 years of calorie restriction. The BioProject accession number is PRJNA1018321. n = 6. All samples are biologically independent replicates, except for figure k for which samples used are repetitive measures of biological samples. Data are represented as mean ± SEM. Statistical significance was assessed using one-way ANOVA (a), one-way repeated (k) measures ANOVA, Student’s t-test (df with Welch’s correction for h), and Mann-Whitney U test (i). Abbreviations: Mesenteric white adipose tissue (mWAT).
Fig. 3
Fig. 3. p53 upregulates FMO3 expression and TMAO production in mature adipocytes.
a A diagram showing two putative p53 responsive elements (RE) on the human FMO3 gene identified by JASPAR. Upper panel: consensus p53 RE suggested by JASPAR. Lower panel: The first and second putative p53 RE sites are located on the promoter and intron 1 of FMO3 gene as indicated. The number of nucleotides is relative to the ATG start codon. bd 3T3-L1 adipocytes treated with DMSO as vehicle or doxorubicin (10 μM) for 24 h were subjected to qPCR analysis (b) and immunoblotting analysis (c). The bar chart in (d is the densitometry analysis of FMO3, p53 and p21 normalized with HSP90. n = 3 for vehicle. n = 4 in (b) and n = 3 in (c) for doxorubicin. e, f 3T3-L1 adipocytes (e) or SVF-derived adipocytes from Adipo-FMO3-KO mice or WT controls (f) were treated with vehicle (Veh) or doxorubicin (Doxo; 10 μM) for 24 h, followed by 200 μM d9-TMA for 16 h. d9-TMAO production in cell lysate or conditioned medium (e, f) as indicated. n = 4 for vehicle, doxorubicin and d9-TMA in (e, f). n = 5 in panel e for doxorubicin ± d9-TMA. n = 4 in the cell lysate and n = 3 in the cell culture medium of panel f for doxorubicin ± d9-TMA. gk 16-week-old male C57BL/6 mice injected with a single dose of 2 mg and 10 mg of doxorubicin per kg of body weight or 1X PBS (Veh) were used. The day before doxorubicin injection is defined as day 0. qPCR analysis of Fmo3, p53 and Cdkn1a mRNA expression are normalized with 36b4 and 18 s in sWAT (g) and eWAT (h). g: n = 5 for vehicle and 2 mg doxorubicin injection, and n = 4 for 10 mg doxorubicin injection for Cdkn1a and p53; for Fmo3, n = 5 for vehicle and 10 mg doxorubicin injection, and n = 4 for 2 mg doxorubicin injection. h: n = 4 for Cdkn1a and p53; for Fmo3, n = 4 for vehicle and 10 mg doxorubicin injection, and n = 5 for 2 mg doxorubicin injection. TMAO level in eWAT and sWAT at day 10 (i) and in serum at day 0 and day 10 (j). i: n = 4 for eWAT. n = 4 for vehicle and 10 mg doxorubicin, and n = 5 for 2 mg doxorubicin for sWAT. j: n = 5. k qPCR analysis of Fmo3 gene expression normalized with 18 s in liver. n = 5. l 3T3-L1 adipocytes were co-transfected with a vector expressing luciferase (pGL3) under the control of Fmo3 promoter or intron-1 region containing p53 RE or no promoter (Basic) for 12 h, followed by treatment with 10 μM nutlin-3a for 24 h. n = 4. m 3T3-L1 adipocytes were co-transfected with plasmids expressing GFP or GFP-tagged p53 together with indicated luciferase vectors for 48 h, followed by measurement of luciferase activity. n = 3. The data are expressed as fold change over pGL3-Basic in the cells treated with Veh (l) or transfected with GFP (m). Data expressed as mean ± SEM, analysed by two-tailed Student’s t-test or one-way ANOVA.
Fig. 4
Fig. 4. Adipocyte-specific deletion of Fmo3 alleviates ageing-induced dysmetabolism in mice.
6 to 8-week-old (so-called “Young”), 48 to 50-week-old (so-called “Middle-aged) and 85 to 105-week-old (so-called “Old”) male WT and KO mice on standard chow diet were used. a Serum levels of TMAO. n = 5. Circulating glucose (b) and serum insulin levels (d) during IPGTT in the 8-week-old and 99-week-old mice; AUC of glucose level during GTT in (c). b, c n = 6 for young and n = 7 for old animals. d n = 6 for WT and n = 4 for KO animals. e, f Circulating glucose level (e) during ITT in the 7-week-old and 87-week-old mice. The bar chart on (f) represents the AUC of glucose during ITT. n = 7 for young and n = 5 for old animals. Circulating glucose (g), insulin (h) and calculated HOMA-IR (i) after fasting for 6 h. n = 7 for young animals. n = 5 for WT and n = 7 KO for old animals. Energy expenditure (j), locomotor activity and its AUC (k, l) oxygen consumption rate (m) and respiratory exchange ratio (RER) (n) measured in the 95-week-old mice using metabolic cage. WT: n = 6. KO: n = 4 in (j and m), and n = 6 in (k and n). o Serum total cholesterol (TC), low-density lipoprotein (LDL) and high-density lipoprotein (HDL) in 105-week-old mice after fasting for 6 h. n = 5 for WT. n = 8 for KO. p Survival rates were compared using log rank test for the trend up to 105 weeks. n = 9. Data are represented as mean ± SEM. Statistical data were analysed by two-tailed Student’s t-test or one-way ANOVA. Significant P-values: # WT-young v/s WT-old; $ KO-young v/s WT-old; * WT-old v/s KO-old.
Fig. 5
Fig. 5. Adipocyte-specific deletion of Fmo3 alleviates ageing-induced adipose tissue inflammation and senescence.
eWAT and serum isolated from 105-week-old male WT and KO mice on standard chow diet were used. a Gene set enrichment analysis (GSEA) plot of WT vs KO mice. Inflammatory response and p53 pathways are downregulated in KO. n = 4 for WT. n = 5 for KO. b qPCR analysis of genes related to inflammation and p53 pathways. n = 5 for WT. n = 6 for KO. c H&E staining. Immune cell clusters are pointed by red arrows. The lower panel is the quantification of the number of immune cells per 103 μm2 of area. Scale bar: 200 µm. n = 5. d Immunofluorescence staining for the macrophage marker F4/80 and iNOS. Bar charts on the right of panel d show the quantification of iNOS level in F4/80+ cells and the number of F4/80+ cells. Scale bar: 200 µm. n = 5. e, f Immunofluorescence staining for cellular senescence marker p53 (e) and DNA damage marker phospho-γ-H2AX (p-H2AX) (f) together with the adipocyte marker perilipin. The bar charts in (e and f) are quantification of p53 and p-H2AX in perilipin+ adipocytes. Scale bar: 200 µm. n = 4 for WT. n = 5 for KO. g Immunoblotting analysis of the proteins related to p53 pathways (p53 and p21) and inflammasome (pro-IL-1β), cleaved-IL-1β (p17), pro-caspase-1, cleaved caspase-1 (p10) and NLRP3. The bar chart on the right panel is the densitometric quantification for the indicated proteins normalized with β-actin. n = 5 for WT. n = 6 for KO. Circulating levels of IL-1β (h), IL-18 (i), MCP-1 (j), adiponectin (k) and leptin (l) in the 105-week-old mice. n = 5 for WT. n = 6 for KO. All samples are biologically independent replicates. Data are represented as mean ± SEM. Statistical data were analysed by the Mann-Whitney U test for (c) and a two-tailed Student’s t-test for the remaining graphs, with Welch’s correction applied for (d).
Fig. 6
Fig. 6. Genetic deletion of adipocyte Fmo3 prevents high-fat-diet-induced adipose tissue senescence, inflammation and fibrosis.
eWAT and serum isolated from 32-week-old male Adipo-FMO3-WT and KO mice on a high-fat diet (HFD, fed from week 8) were used unless stated otherwise. a Serum levels of TMAO. WT: n = 7 for WT. n = 8 for KO. Circulating insulin (b) and glucose (c) after fasting for 6 h. n = 8. d Circulating level of IL-1β. n = 7 for WT. n = 8 for KO. e Circulating glucose levels during IPGTT in the 19-week-old mice on HFD feeding for 11 weeks. n = 8 for WT. n = 6 for KO. f Circulating glucose levels during ITT in the 20-week-old mice fed on high fat diet for 12 weeks. n = 7 for WT. n = 8 for KO. g Circulating serum insulin levels during IPGTT in the 19-week-old mice after 11 weeks of HFD feeding. n = 5. h Calculated HOMA-IR after fasting for 6 h. n = 7 for WT. n = 10 for KO. i FACS analysis of proportions of M1 and M2 macrophage populations in eWAT. n = 5. j SA-β-gal staining for eWAT. n = 5. k H&E staining. Immune cell clusters are pointed by red arrows. The bar chart on the right of (k) is the quantification of the number of immune cells per 103 μm2 of area. n = 11 for WT. n = 8 for KO. l Sirius Red staining. The bar chart in the right panel is the quantification of fibrous structures that are in red color n = 8 for WT. n = 7 for KO. m, n Immunoblotting analysis of the proteins related to inflammasome pro-IL-1β, cleaved-IL-1β pro-caspase-1, cleaved caspase-1 (p10), NLRP3 and ASC (m). The bar chart in panel n is the densitometric quantification for the indicated proteins. n = 7. o TMAO level in eWAT. TMAO level in tissue lysate is normalized with total protein concentration. n = 4 for WT. n = 5 for KO. All samples are biologically independent replicates. Data are represented as mean ± SEM. Statistical data were analysed by the Mann-Whitney U test for (b) and a two-tailed Student’s t-test for the remaining graphs, with Welch’s correction applied for (a, d and k).
Fig. 7
Fig. 7. The FMO3-TMAO axis promotes doxorubicin-induced senescence in mature adipocytes.
ai SVF-derived mature adipocytes from Adipo-FMO3-KO and WT mice were treated with doxorubicin (10 μM) or DMSO as vehicle (Veh) for 20 h, followed by incubation with d9-TMA (500 μM) for 4 h. a qPCR analysis of Fmo3 mRNA expression normalized with 36b4 and 18 s. n = 7 for WT. n = 8 for KO. b d9-TMAO in the cell lysate (n = 3) and conditioned medium (n = 4) as indicated. d9-TMAO level in cell lysate is normalized with total protein concentration. c SA-β-gal staining. The bar graph shows the quantification of the β-gal-positive area (blue color) and presented as fold change over WT-veh. n = 3. dh qPCR analysis of genes related to senescence and inflammation. n = 8 for p53, Cdkn1a and Pycard genes. n = 5 for Il1b and Cdkn2a genes. i IL-1β in the conditioned medium measured as indicated. n = 4. jl eWAT explants from 12-week-old Adipo-FMO3-KO mice or WT control (j) or 12-week-old C57BL/6 mice (k, l) were treated with doxorubicin (10 μM) for 20 h, followed by stimulation with TMA (500 μM) for 4 h. j, k IL-1β level in the conditioned medium. j: n = 3. k: n = 9. l qPCR analysis of the genes related to senescence and normalized with 36b4 and 18 s. n = 8 for vehicle and TMAO. n = 5–8 for doxorubicin and doxorubicin + TMAO. m SGBS mature adipocytes were treated with doxorubicin (1 μM) or DMSO as vehicle (Veh) along with DIM (50 μM) for 20 h, followed by incubation with TMA (500 μM) for 4 h. qPCR analysis of p53, CDKN2A and CDKN1A mRNA expression are normalized with 36B4 and 18S. n = 4. Data are represented as mean ± SEM. Statistical data were analysed by two-tailed Student’s t-test or one-way ANOVA.
Fig. 8
Fig. 8. TMAO binds with PYCARD and induces inflammasome activation in macrophages.
a Lysates from BMDM treated with LPS were incubated with or without proteinase K in the presence of different concentrations of TMAO as indicated for 7 min. The cell lysates were subjected to immunoblotting analysis of ASC and HSP90. b Recombinant ASC proteins were incubated with proteinase K and different concentrations of TMAO for 2 h at 37 °C, followed by immunoblotting analysis (left panel). The ASC recombinant protein was subjected to SDS-PAGE and silver staining to assess purity. c, d Differentiated THP-1 macrophages were primed with LPS (50 ng/mL) for 20 h and incubated with TMAO (500 μM) for 4 h. c qPCR analysis of PYCARD mRNA level normalized with 18S. n = 6. d Immunoblotting analysis of ASC protein. (n = 3). eh THP-1 macrophages were transfected with siRNA against PYCARD (siPYCARD) or scramble control (siScramble) for 48 h, followed by priming with LPS (50 ng/mL) for 20 h and incubation with TMAO (500 μM) for 4 h. qPCR (e) and immunoblotting (f) analysis of PYCARD mRNA and ASC protein, respectively. Measurement of IL-1β (g; n = 5 for scramble control treated with LPS and TMAO, and n = 4 for the remaining) and caspase-1 activity (h; n = 3) in the conditioned medium. i, j Young and Old male WT and KO mice on STC were used. i Immunofluorescence staining of F4/80 and ASC. The bar chart shows the quantification of ASC level in F4/80+ cells. Scale bar: 200 μm. (n = 5). j Immunofluorescence staining for caspase-1 and F4/80. Bar chart in the right panel shows the quantification of caspase-1 level in F4/80+ cells. Scale bar: 200 μm. (n = 5). Data are represented as mean ± SEM. Statistical data were analysed by two-tailed Student’s t-test, with Welch’s correction for (j).

References

    1. Youm, Y. H. et al. Canonical Nlrp3 inflammasome links systemic low-grade inflammation to functional decline in aging. Cell Metab.18, 519–532 (2013). - PMC - PubMed
    1. Liu, Z., Wu, K. K. L., Jiang, X., Xu, A. & Cheng, K. K. Y. The role of adipose tissue senescence in obesity- and ageing-related metabolic disorders. Clin. Sci.134, 315–330 (2020). - PubMed
    1. Palmer, A. K. et al. Targeting senescent cells alleviates obesity-induced metabolic dysfunction. Aging Cell18, e12950 (2019). - PMC - PubMed
    1. Islam, M. T. et al. Senolytic drugs, dasatinib and quercetin, attenuate adipose tissue inflammation, and ameliorate metabolic function in old age. Aging Cell22, e13767 (2023). - PMC - PubMed
    1. Yu, Q. et al. Sample multiplexing for targeted pathway proteomics in aging mice. Proc. Natl. Acad. Sci. USA117, 9723–9732 (2020). - PMC - PubMed

MeSH terms