. 2025 Oct 7;20(10):e0332912.
doi: 10.1371/journal.pone.0332912. eCollection 2025.

Application of ultrasound in assessment of acute lung injury in mice

Affiliations

Application of ultrasound in assessment of acute lung injury in mice

An-Xia Deng et al. PLoS One. .

Abstract

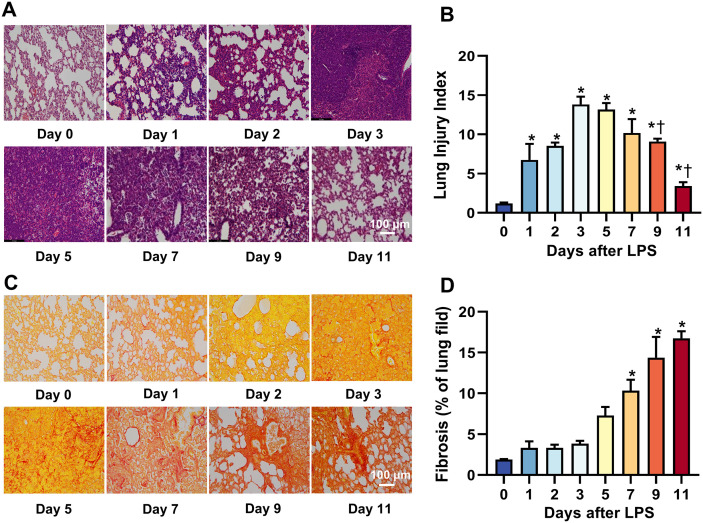
This study evaluated the effectiveness of non-invasive ultrasound technology in monitoring pulmonary edema in a mouse model of acute lung injury (ALI). Male C57BL/6J mice were instilled through the trachea with lipopolysaccharide (LPS, 5 mg/kg, single dose) to induce ALI. The change in B-lines (an ultrasound sign) were monitored using the Vevo 3100 system and the lung ultrasound (LUS) score was generated to quantify the severity of edema, meanwhile lung function was assessed by whole-body plethysmography (WBP) and the progression of ALI was tracked by lung weight and histopathological analysis. LUS detection revealed that non-converging B-lines appeared on the first day, followed by an increase in the number of B-lines that began to converge, peaking on the day-3 and then the number of B-lines decreased, almost disappearing by the 11 days after LPS intervention. Significant changes in lung functional parameters were recorded during 6-24 h with most parameters returning to baseline levels at day-3. Morphological and weight assessments of the lung showed that most severe lung congestion and increased weight at day-3 and returning to normal by 11 days. Histopathological examination unveiled that LPS-induced inflammation was characterized by increased cellular infiltration, thickening of alveolar septa, vascular congestion, and atelectasis, which were most severe on days 3-5 and then gradually improved. A positive correlation between LUS score and the lung injury index (r = 0.783, P < 0.001) or the lung weight-to-tibial length ratio (r = 0.695, P < 0.001) was observed, reflecting a sensitivity of LUS to the severity of edema. In addition, at 24 h following LPS intervention, the LUS score was also positively or negatively correlated with a series of lung functional indices. In conclusion, the study demonstrated that LUS is an effective, reliable and non-invasive tool for monitoring pulmonary edema in a mouse model of ALI. The significant correlations between LUS scores with various pathophysiological parameters, highlight its potential in assessing the severity of ALI in mice.


Conflict of interest statement

The authors have declared that no competing interests exist.

Figures

Fig 1
Fig 1. Position of mice undergoing lung ultrasound (LUS) imaging and the areas examined.
(A) Mice were placed in a supine position to obtain LUS images from the marked four regions on the chest. The scanning order is from (B) right anterior axillary line to right midclavicular line; (C) right midclavicular line to anterior midline; (D) anterior midline to left midclavicular line and to (E) left midclavicular line to left anterior axillary line. (F) Four to five rib gaps are visible in each scanned area. In the LUS image, the 5 arrows represent rib shadows, and the white line between the arrows represents the pleural line.
Fig 2
Fig 2. Specific calculation of B-line score.
(A) In the ultrasound image on the right, only A-lines presented without B-lines, the B-line score for this area = 0. (B) As indicated by the red lines, two vertical B-lines (1 and 2) can be seen, with a B-line score of 2 for this area. (C) Single and fused B-lines can be observed. B-lines marked as 1 and 3 are not fused, thus B-line score 2. The B-line marked as 2 (2−1) indicates a fused B-line, with a score calculated as (0.91 cm/1.31 cm × 10 = 6.94). The total B-line score for this area is 6.94 + 2 = 8.94. (D) B-lines between four intercostal spaces were fused as indicated by red lines and numbered with 1 (1−1), 2 (2−1), 3 (3−1) and 4 (4−1) on the right ultrasound image, the B-line score for this area = (1.25 cm/1.73 cm + 1.12 cm/2.14 cm + 1.31 cm/2.14 cm + 1.09 cm/1.91 cm) × 10 = 24.2. The final B-line score for this mouse were the sum of scores from the four scanned areas.
Fig 3
Fig 3. Dynamic changes of lung ultrasound (LUS) imaging and quantitative analysis.
(A) Representative lung ultrasound images from mice with acute lung injury from 0 (baseline) to 1, 2, 3, 5, 7, 9 and 11 days after tracheal lipopolysaccharide (LPS) instillation, respectively. (B) Changes of LUS derived B-line scores over the 11-day study period. *P < 0.05 vs. 0 day, † P < 0.05 vs. 3 days, n = 11.
Fig 4
Fig 4. Changes in lung function at 0 (baseline) to 6, 12, 24, 48, 72 and 120 h after LPS stimulation were monitored using WBP.
(A) Inspiration time (Ti). (B) Expiration time (Te). (C) Frequency of breathing (F). (D) End expiratory pause (EEP). (E) Tidal volume (TV). (F) Peak inspiratory flow (PIF). (G) Peak expiratory flow (PEF). (H) Pause enhanced (Penh). (I) Expiratory flow at 50% expired volume (EF50). * P < 0.05 vs. 0 h † P < 0.05 vs. 6 h, ‡ P < 0.05 vs. 12 h, # P < 0.05 vs. 24 h, n = 11.
Fig 5
Fig 5. Morphological changes of lungs in mice with acute lung injury.
(A) Representative photos of lungs from mice at baseline (0) and at day 1, 2, 3, 5, 7, 9 and 11 after LPS stimulation, respectively. The most severe congestion was observed at day 3-5, and basically resolved by day 11. (B) Dynamic changes of lung weight/tibial length over the 11 days after LPS intervention. *P < 0.05 vs. 0 day, † P < 0.05 vs. 3 days, n = 5-7/group.
Fig 6
Fig 6. Histological changes of the lung in acute lung injury mice induced by LPS tracheal titration over a 11-day study period.
(A) Representative microscopic images of the lung with hematoxylin and eosin staining. (B) Quantitative analysis of lung injury index. *P < 0.05 vs. 0 day, † P < 0.05 vs. 3 days. (C) microscopic images of the lung with Sirius red staining. (D) Quantitative analysis of pulmonary fibrosis. *P < 0.05 vs. 0 day, n = 5-7/group.
Fig 7
Fig 7. Correlation analysis of lung ultrasound (LUS) scores with the lung injury index, lung weight-to-tibial length ratio (LW/TL), and pulmonary function parameters in a mice model of acute lung injury.
LUS scores significantly and positively correlated with the lung injury index (A) and the LW/TL ratio (B) across all study time points, n = 42. LUS scores positively correlated with expiratory time (Te, C) and end-expiratory pause (EEP, D) at 24 h after LPS intervention. LUS scores negatively correlated with tidal volume (TV, E) and peak expiratory flow (PEF, F). LUS scores positively correlated with enhanced pause (Penh, G) and expiratory flow at 50% vital capacity (EF50, H) at 24 h after LPS intervention. n = 11.

References

    1. Thompson BT, Chambers RC, Liu KD. Acute respiratory distress syndrome. N Engl J Med. 2017;377(6):562–72. doi: 10.1056/nejmra1608077 - DOI - PubMed
    1. Hughes KT, Beasley MB. Pulmonary manifestations of acute lung injury: more than just diffuse alveolar damage. Arch Pathol Lab Med. 2017;141(7):916–22. doi: 10.5858/arpa.2016-0342-RA - DOI - PubMed
    1. Yıldırım F, Karaman İ, Kaya A. Current situation in ARDS in the light of recent studies: classification, epidemiology and pharmacotherapeutics. Tuberk Toraks. 2021;69(4):535–46. doi: 10.5578/tt.20219611 - DOI - PubMed
    1. Zhang Y-L, Zhang W-X, Yan J-Q, Tang Y-L, Jia W-J, Xu Z-W, et al. Chalcone derivatives ameliorate lipopolysaccharide-induced acute lung injury and inflammation by targeting MD2. Acta Pharmacol Sin. 2022;43(1):76–85. doi: 10.1038/s41401-021-00764-8 - DOI - PMC - PubMed
    1. Imam F, Al-Harbi NO, Al-Harbi MM, Ansari MA, Zoheir KMA, Iqbal M, et al. Diosmin downregulates the expression of T cell receptors, pro-inflammatory cytokines and NF-κB activation against LPS-induced acute lung injury in mice. Pharmacol Res. 2015;102:1–11. doi: 10.1016/j.phrs.2015.09.001 - DOI - PubMed

Substances

LinkOut - more resources