. 2025 Oct 7;16(1):8898.
doi: 10.1038/s41467-025-63952-8.

Fate mapping of peripherally-derived macrophages after traumatic brain injury in mice reveals a long-lasting population with a distinct transcriptomic signature

Affiliations

Fate mapping of peripherally-derived macrophages after traumatic brain injury in mice reveals a long-lasting population with a distinct transcriptomic signature

Maria Serena Paladini et al. Nat Commun. .

Abstract

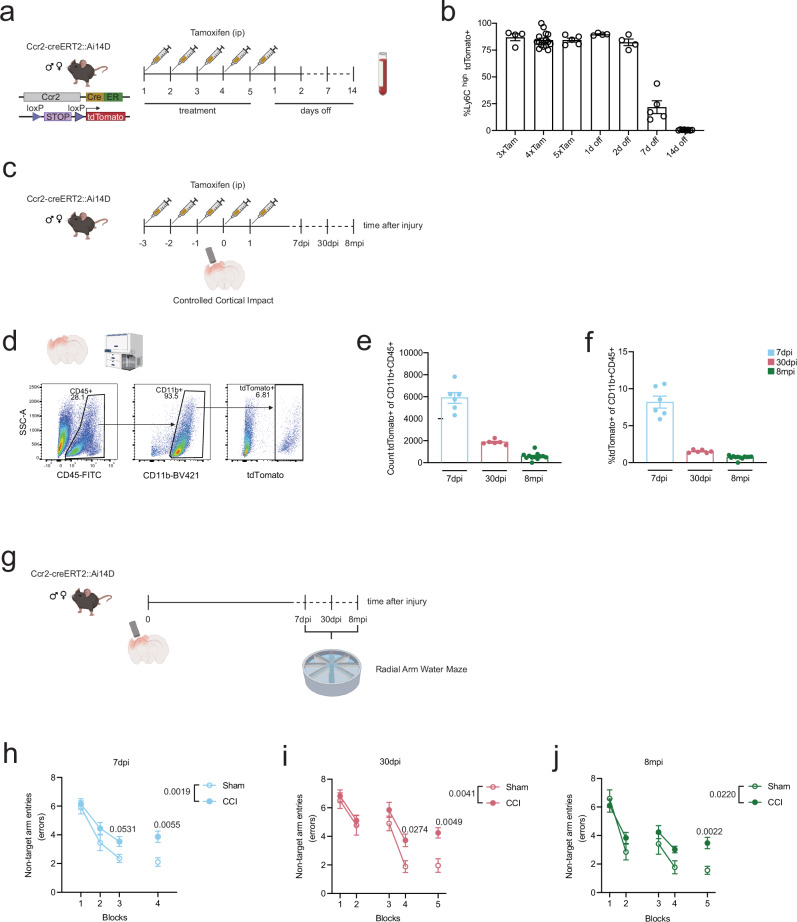
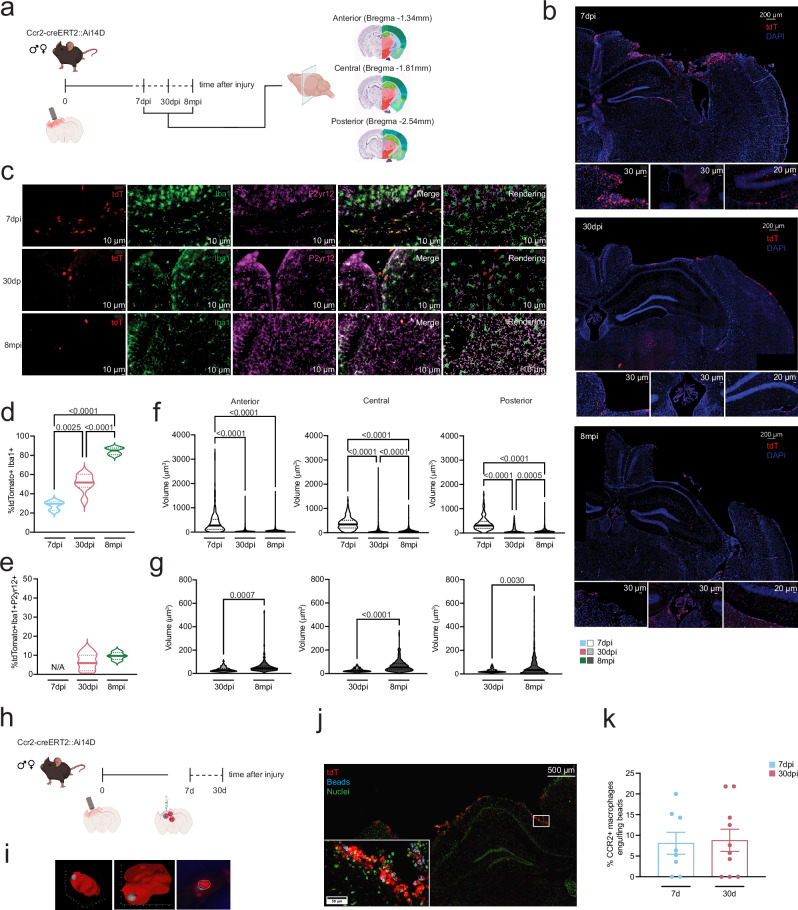
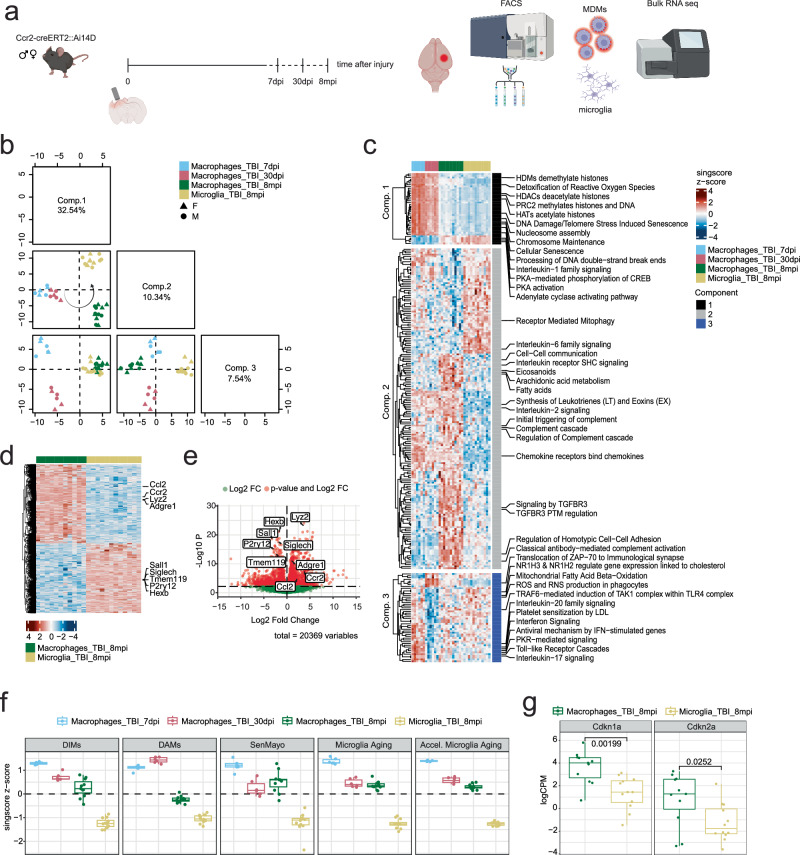
Traumatic brain injury (TBI) is an environmental risk factor for dementia and long-term neurological deficits, posing a significant public health challenge. TBI-induced neuroinflammation involves both brain-resident microglia and peripheral monocyte-derived macrophages (MDMs). Previous research has shown that MDMs contribute to the development of long-term memory deficits, yet their long-term behavior following brain infiltration remains unclear. To address this, our study uses two complementary fate-mapping mouse lines, CCR2-creERT2 and Ms4a3-cre, for precise and lasting tracking of MDMs in vivo. Here we show that MDMs persist in the brain for at least 8 months post-TBI in both male and female mice. MDMs retain phagocytic activity for at least 30 days post-TBI, remain transcriptionally distinct from microglia, and display a gene expression profile associated with aging and disease. Moreover, we identify a core transcriptomic signature of MDMs shared across various mouse models and brain perturbations, which is also enriched in the brain myeloid cells of male subjects with TBI and Alzheimer's disease patients. These findings enhance our understanding of MDMs' dynamics after TBI and inform future targeted myeloid-based therapies.


Conflict of interest statement

Competing interests: The authors declare no competing interests.

Figures

Fig. 1
Fig. 1. MDMs accumulate and persist in the mouse brain for at least 8 months after TBI, paralleled by long-lasting cognitive deficits.
a Experimental design - tamoxifen-induced labeling of Ly6Chi-Ccr2+ blood monocyte in Ccr2-creERT2::Ai14D mice. Blood from the tail vein was collected at different time point and analyzed by flow cytometry. b Percentage of blood Ly6Chi monocytes efficiently labeled (tdTomato + ) in male and female Ccr2-creERT2::Ai14D mice. Individual animals are plotted (3xTam n = 4, 4xTam n = 15, 5xTam n = 5, 1 d off n = 4, 2 d off n = 4, 7 d off n = 5, 14 d off n = 8). Data are expressed as the mean of the examined variable ± SEM. c Experimental design - female and male Ccr2-creERT2::Ai14D mice received 5 doses of tamoxifen and were injured using the Controlled Cortical Impact model of TBI on the fourth day of tamoxifen treatment. d Gating strategy for quantifying Ccr2+ (tdTomato+) cells from the TBI brain of Ccr2-creERT2::Ai14D mice at 7 and 30 days post injury (dpi) and at 8 months post TBI injury (mpi). e Average cell number of Ccr2+ (tdTomato + ) cells in the CD11b + CD45+ population f Percentage of Ccr2+ (tdTomato + ) cells in the CD11b + CD45+ population. Individual animals are plotted (7dpi n = 6, 30dpi n = 6, 8mpi n = 12). Data are expressed as the mean of the examined variable ± SEM. g Experimental design - Ccr2-creERT2::Ai14D mice were tested in the Radial Arm Water Maze (RAWM) task to detect TBI-induced cognitive deficits at 7 and 30dpi and at 8mpi. hj Injured Ccr2-creERT2::Ai14D mice made significantly more errors when performing the RAWM task compared to sham (Two-way RM ANOVA revealed TBI effect p  =  0.0019 and time effect p  <  0.0001 at 7dpi; TBI effect p  =  0.0041 and time effect p  <  0.0001 at 30dpi and TBI effect p  =  0.0220 and time effect p  <  0.0001 at 8mpi). 7dpi n = 12 males, 6 females; 30dpi n = 7 males, 12 females; 8mpi n = 11 males, 13 females. Data are expressed as the mean of the examined variable ± SEM. Statistical differences from multiple comparison tests are denoted in the graphs. (Two-way RM ANOVA with Šidák multiple comparisons test, shown in the figure). Source data are provided as a Source Data file. Created in BioRender. Krukowski, K. (2025) https://BioRender.com/36oc46m.
Fig. 2
Fig. 2. MDMs infiltrate the pericontusional region and maintain their phagocytic ability after engraftment.
a Experimental design - Ccr2-creERT2::Ai14D mice were injured using the controlled cortical impact TBI model and brain samples were collected at 7 and 30 days post injury (dpi) and at 8 months post TBI injury (mpi). Pericontusional regions (top quarter of a coronal brain section) were acquired as 20x z-stacked tiled images. Cavitation images were acquired at 3 different coordinates from Bregma: −1.34 mm (Anterior), −1.81 mm (Central) and −2.54 mm (Posterior). Nissl (left) and anatomical annotations (right) from the Allen Mouse Brain Atlas and Allen Reference Atlas – Mouse Brain. Allen Mouse Brain Atlas, mouse.brain-map.org and atlas.brain-map.org. Anatomical annotations from the Allen Reference Atlas – Mouse Brain, https://atlas.brain-map.org/. b Representative images of pericontusional regions of Ccr2-creERT2::Ai14D mice at different time points. c Representative example of machine learning-based surface rendering (Imaris 10.2.0) at different time points. d % of tdTomato+ cells that express Iba1. e % of tdTomato+ cells that express Iba1 and P2ry12. f Volume (µm3) of tdTomato+Iba1+ cells across the 3 selected coronal sections. g Volume (µm3) of tdTomato+Iba1+P2ry12+ cells across the 3 selected coronal sections. Violin plots depict the distribution of samples. 7dpi n = 2 males, 1 female; 30dpi n = 3 males, 4 females; 8mpi n = 2 males, 2 females. (One-way ANOVA and two-sided unpaired Student’s t-test, statistical difference are denoted in the graphs). h Experimental design - Ccr2-creERT2::Ai14D mice were injured using the controlled cortical impact TBI model and phagocytosis capacity was measured at 7 and 30dpi. Fluorescent beads (2μm diameter) were injected in the ipsilateral hippocampus, and brains were collected 3 days after for IF analysis. i 3D rendering of MDM engulfing one bead and K-means segmentation overlay. j Representative confocal image of MDMs (tdTomato, red) engulfing injected beads (blue) in the pericontusional area. Nuclei are visualized in green. k % of tdTomato+ macrophages that engulfed one or more fluorescent beads was quantified for each acquired image. Each dot is the average of 2/4 images acquired for each animal. Individual animals are plotted (7dpi n = 4 males, 4 females; 30dpi n = 5 males, 5 females). Data are expressed as the mean of the examined variable ± SEM. (Two-sided unpaired Student’s t-test). Source data are provided as a Source Data file. Created in BioRender. Krukowski, K. (2025) https://BioRender.com/uoqnpdv.
Fig. 3
Fig. 3. Transcriptomic signatures of MDMs after TBI.
a Experimental design - Ccr2-creERT2::Ai14D mice were injured using the controlled cortical impact traumatic brain injury (TBI) model and brain samples were collected at 7 and 30 days post injury (dpi) and at 8 months post TBI injury (mpi). Microglia (tdTomato-) and monocyte-derived macrophages (MDMs) (tdTomato+) cells were isolated from the CD11b + CD45+ brain cell population by fluorescence-activated cell sorting (FACS) and processed for bulk RNA sequencing. b Projections of samples onto the first three components from sparse partial least squares discriminant analysis (sPLS-DA) of Reactome singscore scores from TBI MDMs at 7dpi, 30dpi, and 8mpi, with 8mpi TBI microglia. c Heatmap of Reactome singscore z-scores for significant terms for each component selected by sPLS-DA. The top terms for discriminating each group are shown. d Heatmap and e volcano plot of differentially expressed genes from TBI MDMs and microglia at 8mpi. f Reactome singscore z-scores for reference signatures of disease-inflammatory macrophages (DIMs), disease-associated microglia (DAMs), SenMayo, Microglia Aging, and Accelerated Microglia Aging (see methods). g Expression (logCPM) of Cdkn1a (p21) and Cdkn2a (p16) in TBI MDMs and microglia 8 months after injury (two-sided Welch’s t-tests with Holm multiple testing correction, p-value in the graph, Cdkn1a df=20.83321, Cdkn2a df=17.89013). Individual animals are plotted (MDMs: 7dpi n = 3 females, 3 males; 30dpi n = 3 females, 3 males; 8mpi n = 5 females, 6 males. Microglia 8mpi: n = 6 females, 6 males). Box plots depict data quartiles. Source data are provided as a Source Data file. Created in BioRender. Krukowski, K. (2025) https://BioRender.com/7s7n0z7.
Fig. 4
Fig. 4. Murine MDMs share a core transcriptomic signature enriched in human brain myeloid cells from TBI and AD patients.
a Experimental design - Ms4a3-cre::Ai14D mice were injured using the controlled cortical impact traumatic brain injury (TBI) model and brain samples were collected at different time points. Monocyte-derived macrophages (MDMs) (tdTomato + ), microglia (CD11b + , CD45mid/low, tdTomato-) and inflammatory monocytes (Ly6G-,Ly6Chi) were sorted from brain and blood by fluorescence-activated cell sorting (FACS) and processed for bulk RNA sequencing. b LogCPM of Ccr2 transcripts across datasets (two-sided Welch’s t-tests with Holm multiple testing correction, p-value in the graph, left - Ccr2-creERT2::Ai14D 30dpi vs 7dpi MDMs (df=8.994; 7dpi n = 3 females, 3 males; 30dpi n = 3 females, 3 males), middle - Ccr2-creERT2::Ai14D 8 months post injury (mpi) MDMs vs microglia (df=20.341; MDMs: n = 5 females, 6 males; Microglia: n = 6 females, 6 males), right - Ms4a3-cre::Ai14D 30dpi vs 7dpi MDMs (df=8.228; 7dpi n = 4 males, 4 females; 30dpi n = 3 males) and microglia (df=6.475; 7dpi n = 4 males, 4 females; 30dpi n = 3 males)). c Heatmap of differentially expressed genes (DEGs) from Ms4a3-cre::Ai14D TBI MDMs and microglia 7 days after injury. d Volcano plot of DEGs from Ms4a3-cre::Ai14D TBI MDMs and microglia 7 days after injury. e Heatmap of DEGs from Ms4a3-cre::Ai14D TBI MDMs and microglia 30 days after injury. f Volcano plot of Ms4a3-cre::Ai14D DEGs from TBI MDMs and microglia 30 days after injury. g Singscore z-scores for reference datasets in Ms4a3-cre::Ai14D mice. h Projections of TBI samples from Ccr2-creERT2::Ai14D and Ms4a3-cre::Ai14D models onto the first three components from sparse partial least squares discriminant analysis (sPLS-DA) of singscore scores for cell type signatures from the Molecular Signatures Database (MSigDB). Individual animals are plotted (Ccr2-creERT2::Ai14D mice (MDMs: 7dpi n = 3 males, 3 females; 30dpi n = 3 males, 3 females; 8mpi n = 6 males, 5 females. Microglia 8mpi: n = 6 males, 6 females) and Ms4a3-cre::Ai14D mice (MDMs: 7dpi n = 4 males, 4 females; 30dpi n = 3 males. TBI Microglia: 7dpi n = 4 males, 4 females; 30dpi n = 3 males. Sham Microglia: 7dpi n = 2 males, 1 female. Monocytes: 7dpi n = 4 males, 4 females; 30dpi n = 3 males, 3 females)). Box plots depict data quartiles. (i) UpSet plot of the overlaps between DEGs from different datasets (see Methods). j Selected gene ontology (GO) terms enriched in the list of the 114 genes commonly enriched in MDMs. k Violin plots of Core MDMs UCell signature scores in human TBI single-nucleus RNAseq. l UMAP feature plot of Core MDMs UCell signature scores in human TBI single-nucleus RNAseq (n = 7 TBI patients, n = 7 controls). m Violin plots of Core MDMs UCell signature scores in Alzheimer’s Disease (AD) dataset from Seattle Alzheimer’s Disease Brain Cell Atlas (SEA-AD). n Umap feature plot of Core MDMs UCell signature scores in AD dataset from SEA-AD (n = 42 AD patients with dementia, n = 42 controls). ****p < 0.0001 (one-sided Mann-Whitney U test). All p-values were corrected for multiple testing using Benjamini-Hochberg (FDR) correction. Only results with p < 0.0001 are presented in the figure to emphasize the most robust findings. Source data are provided as a Source Data file. Created in BioRender. Frias, E. (2025) https://BioRender.com/bg3exxa.

References

    1. Blennow, K. et al. Traumatic brain injuries. Nat. Rev. Dis. Prim.2, 16084 (2016). - PubMed
    1. Guan, B., Anderson, D. B., Chen, L., Feng, S. & Zhou, H. Global, regional and national burden of traumatic brain injury and spinal cord injury, 1990–2019: a systematic analysis for the Global Burden of Disease Study 2019. BMJ Open13, e075049 (2023). - PMC - PubMed
    1. Maas, A. I. R. et al. Traumatic brain injury: progress and challenges in prevention, clinical care, and research. Lancet Neurol.21, 1004–1060 (2022). - PMC - PubMed
    1. Kaur, P. & Sharma, S. Recent Advances in Pathophysiology of Traumatic Brain Injury. Curr. Neuropharmacol.16, 1224–1238 (2018). - PMC - PubMed
    1. Ng, S. Y. & Lee, A. Y. W. Traumatic brain injuries: pathophysiology and potential therapeutic targets. Front. Cell. Neurosci.13, 528 (2019). - PMC - PubMed

MeSH terms

LinkOut - more resources