. 2025 Oct 7;16(1):716.
doi: 10.1038/s41419-025-08047-4.

E3 Ubiquitin ligases Cbl-b and c-Cbl maintain the homeostasis of macrophages by regulating the M-CSF/M-CSFR signaling axis

Affiliations

E3 Ubiquitin ligases Cbl-b and c-Cbl maintain the homeostasis of macrophages by regulating the M-CSF/M-CSFR signaling axis

Fei Xu et al. Cell Death Dis. .

Abstract

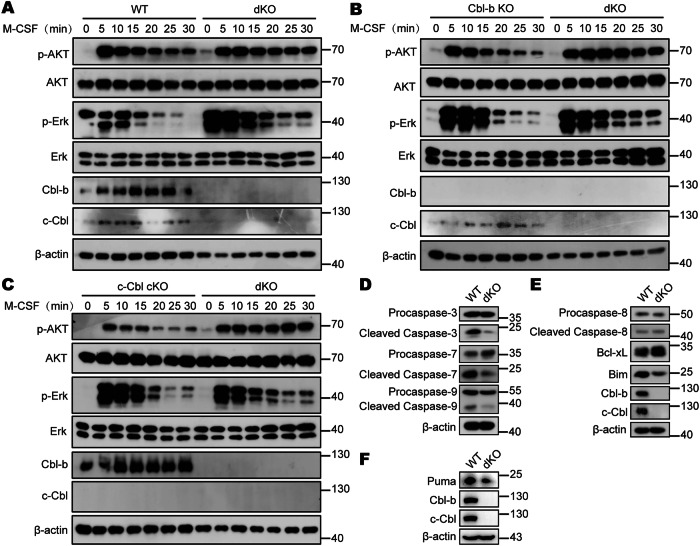
The Casitas B-lineage lymphoma (Cbl) family proteins are E3 ubiquitin ligases implicated in the regulation of various immune cells. However, their function in macrophages remains unclear. Here, we identify both Cbl-b and c-Cbl (Cbls) as inhibitors of macrophage proliferation and promoters of macrophage apoptosis. Mechanically, we identify that Cbls functions upstream of AKT and Erk to mediate the ubiquitination and degradation of M-CSFR. M-CSF stimulation promotes dimerization and autophosphorylation activation of M-CSFR on the macrophage membrane, thereby activating downstream PI3K-AKT and Erk signaling pathways, leading to different biological effects such as macrophage proliferation and survival. At the same time, the Y559 site of the M-CSFR undergoes autophosphorylation, which can promote receptor recruitment and phosphorylation of Cbls. This promotes Cbls to induce K63-linked polyubiquitination at the K791 site of M-CSFR, leading to internalization and degradation of M-CSFR through lysosomal pathways, preventing excessive activation of the signaling pathway. Furthermore, Cbls deficiency results in increased proliferation and decreased apoptosis of macrophages in vitro and in vivo and dKO mice spontaneously develop a macrophage-dominated pulmonary enlargement. Together, these data demonstrate that Cbls play critical roles in the regulation of macrophage homeostasis by inhibiting M-CSFR-mediated AKT and Erk activation.


Conflict of interest statement

Competing interests: The authors declare no competing interests.

Figures

Fig. 1
Fig. 1. Accelerated proliferation and improved survival of Cbls-deficient BMDMs.
A Microscopy of clonal morphology of WT, Cbl-b KO, c-Cbl cKO and dKO BMDMs generated in M-CSF dependent BM cell culture (r = 3 per group); scale bar, 100 μm. B Statistics of absolute number of WT, Cbl-b KO, c-Cbl cKO and dKO BMDMs generated in M-CSF dependent BM cell culture (r = 3 per group). Proliferation of WT, Cbl-b KO, c-Cbl cKO and dKO BMDMs generated in M-CSF dependent BM cell culture. Shown are FACS analyses C and statistics D of BrdU+ F4/80+ CD11b+ cells (r = 3 per group). WT, Cbl-b KO, c-Cbl cKO and dKO BMDMs were cultured in the presence of M-CSF (20 ng/mL) for 7 days. Then proportion of macrophages was analyzed by flow cytometry. FACS analyses E and statistics F of F4/80+ CD11b+ cells (r = 3 per group). G Quantitative PCR analysis of the expression levels of cell cycle-related genes c-Myc, cyclin D1 and cyclin D2 in WT and dKO BMDMs cultured in the presence of M-CSF (20 ng/mL) for the indicated times (r = 3 per group). WT, Cbl-b KO, c-Cbl cKO and dKO BMDMs were cultured in the presence of M-CSF (20 ng/mL) for 7 days. Then apoptosis rates were analyzed by flow cytometry. FACS analyses H and statistics I of Annexin V+ 7AAD and Annexin V+ 7AAD+ F4/80+ CD11b+ cells (r = 3 per group). WT, Cbl-b KO, c-Cbl cKO and dKO BMDMs were cultured in the presence of M-CSF (20 ng/mL) for 5 days, followed by culturing in M-CSF-free medium for another 2 days. Then apoptosis rates were analyzed by flow cytometry. FACS analyses J and statistics K of Annexin V+ 7AAD and Annexin V+ 7AAD+ F4/80+ CD11b+ cells (r = 3 per group). The “r” represents the number of times the technology is repeated. One-Way ANOVA comparisons for B, D, F, I and K, unpaired Student’s t test for G. ns, no significance, *p < 0.05, **p < 0.01, ***p < 0.001, ****p < 0.0001. p < 0.05 was considered statistically significant.
Fig. 2
Fig. 2. dKO BMDMs exhibit prolonged AKT and Erk activation upon M-CSF stimulation.
A WT and dKO BMDMs were starved of M-CSF for 24 h and restimulated with M-CSF (50 ng/mL) for indicated times and harvested for western blot analysis of p-AKT and p-Erk. B Cbl-b KO and dKO BMDMs were starved of M-CSF for 24 h and restimulated with M-CSF (50 ng/mL) for indicated times and harvested for western blot analysis of p-AKT and p-Erk. C c-Cbl cKO and dKO BMDMs were starved of M-CSF for 24 h and restimulated with M-CSF (50 ng/mL) for indicated times and harvested for western blot analysis of p-AKT and p-Erk. D Western blot analysis of cleaved caspase-3, -7, -9 in WT and dKO BMDMs generated in M-CSF dependent BM cell culture. E Western blot analysis of cleaved caspase-8, Bim and Bcl-xL in WT and dKO BMDMs generated in M-CSF dependent BM cell culture. F Western blot analysis of Puma in WT and dKO BMDMs generated in M-CSF dependent BM cell culture.
Fig. 3
Fig. 3. Cbls collaboratively inhibit M-CSF-dependent cell proliferation and promote cell apoptosis by down-regulating M-CSFR protein levels.
A Western blot analysis of M-CSFR expression in WT, Cbl-b KO, c-Cbl cKO and dKO BMDMs. And the data was quantified using Image J software. The molecular masses of the mature M-CSFR (175 kDa) and its precursor (140 kDa) are indicated. B Quantitative PCR analysis of M-CFSR mRNA levels in WT, Cbl-b KO, c-Cbl cKO and DKO BMDMs (r = 3 per group). C Microscopy of clonal morphology of WT, dKO, dKO (DMSO) and dKO (BLZ945) BMDMs generated in M-CSF dependent BM cell culture (r = 3 per group); scale bar, 100 μm. Proliferation of WT and dKO BMDMs generated in M-CSF dependent BM cell culture which added BLZ945. Shown are FACS analyses D and statistics E of BrdU+ F4/80+ CD11b+ cells (r = 3 per group). Apoptosis of WT and dKO BMDMs generated in M-CSF dependent BM cell culture which added BLZ945. Shown are FACS analyses F and statistics G of Annexin V+ 7AAD and Annexin V+ 7AAD+ F4/80+ CD11b+ cells (r = 3 per group). H dKO BMDMs were starved of M-CSF for 24 h and treated with M-CSF (50 ng/mL) and different concentrations of BLZ945 for indicated times and harvested for western blot analysis of p-AKT and p-Erk. I dKO BMDMs treated with different concentrations of BLZ945 and harvested for western blot analysis of cleaved caspase-3, -7, -8, -9, Bim and Bcl-xL. The “r” represents the number of times the technology is repeated. One-Way ANOVA comparisons for B, unpaired Student’s t test for E and G. ns, no significance, ***p < 0.001. p < 0.05 was considered statistically significant.
Fig. 4
Fig. 4. Cbls mediate the ubiquitination and subsequent degradation of M-CSFR in response to M-CSF induction.
A Immunoprecipitation analysis of the exogenous interaction between His-M-CSFR and Myc-Cbl-b in HEK293T cells. B Immunoprecipitation analysis of the exogenous interaction between His-M-CSFR and Myc-c-Cbl in HEK293T cells. C WT BMDMs were starved of M-CSF for 24 h and restimulated with M-CSF (50 ng/mL) and harvested for immunoprecipitation analysis of the endogenous interaction between M-CSFR and Cbl-b. D WT BMDMs were starved of M-CSF for 24 h and restimulated with M-CSF (50 ng/mL) and harvested for immunoprecipitation analysis of the endogenous interaction between M-CSFR and c-Cbl. E Immunoprecipitation analysis of polyubiquitination of M-CSFR in HEK293T cells cotransfected with His-M-CSFR, HA-Ub and Myc-Cbl (Cbl-b or c-Cbl) and then treated with M-CSF (50 ng/mL) for 2 h. F Western blot analysis of M-CSFR in HEK293T cells cotransfected with His-M-CSFR and Myc-Cbl (Cbl-b or c-Cbl) and then treated with M-CSF (50 ng/mL) and CHX (50 µM) for 2 h. G WT and dKO BMDMs were starved of M-CSF for 24 h and restimulated with M-CSF (50 ng/mL) for 3 min and harvested for Co-immunoprecipitation analysis of polyubiquitination of M-CSFR. H WT, Cbl-b KO, c-Cbl cKO and dKO BMDMs were starved of M-CSF for 24 h and restimulated with M-CSF (50 ng/mL) for 3 min and harvested for Co-immunoprecipitation analysis of polyubiquitination of M-CSFR. I WT and dKO BMDMs were starved of M-CSF for 24 h and restimulated with M-CSF (50 ng/mL) for indicated times and harvested for western blot analysis of degradation of M-CSFR. J Cbl-b KO and dKO BMDMs were starved of M-CSF for 24 h and restimulated with M-CSF (50 ng/mL) for indicated times and harvested for western blot analysis of degradation of M-CSFR. K c-Cbl cKO and dKO BMDMs were starved of M-CSF for 24 h and restimulated with M-CSF (50 ng/mL) for indicated times and harvested for western blot analysis of degradation of M-CSFR. L Western blot analysis of M-CSFR in HEK293T cells cotransfected with His-M-CSFR and Myc-Cbl (Cbl-b or c-Cbl) and then treated with M-CSF (50 ng/mL), DMSO, CQ (20 µM) and MG132 (10 µM) for 2 h as indicated.
Fig. 5
Fig. 5. Phosphorylation of Cbls is critical for M-CSFR ubiquitination and degradation.
A Immunoprecipitation analysis of tyrosine phosphorylation of Cbl-b in RAW 264.7 cells treated with M-CSF (50 ng/mL). B Immunoprecipitation analysis of tyrosine phosphorylation of c-Cbl in RAW 264.7 cells treated with M-CSF (50 ng/mL). C WT BMDMs were starved of M-CSF for 24 h and restimulated with M-CSF (50 ng/mL) and harvested for Immunoprecipitation analysis of tyrosine phosphorylation of Cbl-b. D WT BMDMs were starved of M-CSF for 24 h and restimulated with M-CSF (50 ng/mL) and harvested for Immunoprecipitation analysis of tyrosine phosphorylation of c-Cbl. E Immunoprecipitation analysis of tyrosine phosphorylation of Cbl-b in HEK293T cells cotransfected with Myc-Cbl-b and His-M-CSFR and then treated with M-CSF (50 ng/mL) for 3 min. F Immunoprecipitation analysis of tyrosine phosphorylation of c-Cbl in HEK293T cells cotransfected with Myc-c-Cbl and His-M-CSFR and then treated with M-CSF (50 ng/mL) for 3 min. G Immunoprecipitation analysis of tyrosine phosphorylation of Cbl-b in HEK293T cells cotransfected with Myc-Cbl-b and His-M-CSFR (WT or K614M) and then treated with M-CSF (50 ng/mL) for 3 min. H Immunoprecipitation analysis of tyrosine phosphorylation of c-Cbl in HEK293T cells cotransfected with Myc-c-Cbl and His-M-CSFR (WT or K614M) and then treated with M-CSF (50 ng/mL) for 3 min. I Western blot analysis of M-CSFR in HEK293T cells cotransfected with His-M-CSFR and Myc-Cbl-b (WT or its tyrosine mutants) and then treated with M-CSF (50 ng/mL) and CHX (50 µM) for 2 h. J Western blot analysis of M-CSFR in HEK293T cells cotransfected with His-M-CSFR and Myc-c-Cbl (WT or its tyrosine mutants) and then treated with M-CSF (50 ng/mL) and CHX (50 µM) for 2 h. K Immunoprecipitation analysis of polyubiquitination of M-CSFR in HEK293T cells cotransfected with His-M-CSFR, HA-Ub and Myc-Cbl-b (WT or Y363F) and then treated with M-CSF (50 ng/mL) for 2 h. L Immunoprecipitation analysis of polyubiquitination of M-CSFR in HEK293T cells cotransfected with His-M-CSFR, HA-Ub and Myc-c-Cbl (WT or Y369F) and then treated with M-CSF (50 ng/mL) for 2 h.
Fig. 6
Fig. 6. Cbls mediate the K63-linked polyubiquitination modification at Lys791 of M-CSFR.
A Model diagram of M-CSFR structure and its potential ubiquitination site. B Highly conserved lysine (K) residues (K791) on M-CSFR from different species. C Western blot analysis of M-CSFR in HEK293T cells cotransfected with His-M-CSFR (WT or its lysine mutants) and Myc-Cbl-b and then treated with M-CSF (50 ng/mL) and CHX (50 µM) for 2 h. D Western blot analysis of M-CSFR in HEK293T cells cotransfected with His-M-CSFR (WT or its lysine mutants) and Myc-c-Cbl and then treated with M-CSF (50 ng/mL) and CHX (50 µM) for 2 h. E Immunoprecipitation analysis of polyubiquitination of M-CSFR in HEK293T cells cotransfected with His-M-CSFR (WT or K791R), HA-Ub and Myc-Cbl-b and then treated with M-CSF (50 ng/mL) for 2 h. F Immunoprecipitation analysis of polyubiquitination of M-CSFR in HEK293T cells cotransfected with His-M-CSFR (WT or K791R), HA-Ub and Myc-c-Cbl and then treated with M-CSF (50 ng/mL) for 2 h. G Immunoprecipitation analysis of polyubiquitination types of M-CSFR in HEK293T cells cotransfected with His-M-CSFR, Myc-Cbl-b and different types of HA-Ub and then treated with M-CSF (50 ng/mL) for 2 h. H Immunoprecipitation analysis of polyubiquitination types of M-CSFR in HEK293T cells cotransfected with His-M-CSFR, Myc-c-Cbl and different types of HA-Ub and then treated with M-CSF (50 ng/mL) for 2 h. I WT and dKO BMDMs were starved of M-CSF for 24 h and restimulated with M-CSF (50 ng/mL) for 3 min and harvested for Co-immunoprecipitation analysis of K63-linked polyubiquitination of M-CSFR.
Fig. 7
Fig. 7. Tissue macrophages are increased in dKO mice.
A Flow cytometry analysis of macrophages (LY-6G- F4/80+ CD11b+) in spleens from four groups of mice (n = 3-4 per group). Statistics of percentage B and absolute number C of macrophages in spleens from four groups of mice (n = 3-4 per group), as shown in A. D Flow cytometry analysis of macrophages (LY-6G- F4/80+ CD11b+) in leukocytes which were isolated from four groups of mice livers (n = 3-4 per group). Statistics of percentage E and absolute number F of macrophages in leukocytes which were isolated from four groups of mice livers (n = 3-4 per group), as shown in D. G Flow cytometry analysis of macrophages (LY-6G- F4/80+ CD11b+) in bone marrow from four groups of mice livers (n = 3 per group). Statistics of percentage H and absolute number I of macrophages in bone marrow from four groups of mice livers (n = 3 per group), as shown in G. The “n” represents the number of biologically independent samples. One-Way ANOVA comparisons for B, C, E, F, H and I. *p < 0.05, **p < 0.01, ***p < 0.001. p < 0.05 was considered statistically significant.
Fig. 8
Fig. 8. Abnormal macrophage accumulation in the lungs of dKO mice.
A Lungs of mice of all four genotypes were dissected for morphologic examination (n = 3 per group). B Flow cytometry analysis of AMs (CD45+ Siglec-F+ CD11bint CD64+ CD11c+) in lungs from four groups of mice (n = 4 per group). Statistics of percentage C and absolute number D of AMs in lungs from four groups of mice (n = 4 per group), as shown in B. E Flow cytometry analysis of interstitial macrophages (IMs) (CD11c+ IA/IE+ CD24- Siglec-F- CD11bhigh) in lungs from four groups of mice (n = 4 per group). Statistics of percentage F and absolute number G of IMs in lungs from four groups of mice (n = 4 per group), as shown in E. H Microscopy of hematoxylin and eosin staining of lung sections from four groups of mice (n = 6 per group); scale bar, 100 μm. I Survival curves of four groups of mice (n = 15 per group). J Microscopy of hematoxylin and eosin staining on lung sections of dKO mice (n = 3 per group) in the control group (Vehicle) and the administration group (BLZ945); scale bar, 200 μm. The “n” represents the number of biologically independent samples. One-Way ANOVA comparisons for C, D, F and G, log-rank tests for I. ****p < 0.0001. p < 0.05 was considered statistically significant.

References

    1. Martinez FO, Helming L, Gordon S. Alternative activation of macrophages: an immunologic functional perspective. Annu Rev Immunol. 2009;27:451–83. - PubMed
    1. Epelman S, Lavine KJ, Randolph GJ. Origin and functions of tissue macrophages. Immunity. 2014;41:21–35. - PMC - PubMed
    1. Peiró T, Patel DF, Akthar S, Gregory LG, Pyle CJ, Harker JA, et al. Neutrophils drive alveolar macrophage IL-1β release during respiratory viral infection. Thorax. 2018;73:546–56. - PMC - PubMed
    1. Li F, Okreglicka KM, Piattini F, Pohlmeier LM, Schneider C, Kopf M. Gene therapy of Csf2ra deficiency in mouse fetal monocyte precursors restores alveolar macrophage development and function. JCI insight. 2022;7:e152271. - PMC - PubMed
    1. Kopf M, Schneider C, Nobs SP. The development and function of lung-resident macrophages and dendritic cells. Nat Immunol. 2015;16:36–44. - PubMed

Substances

LinkOut - more resources