Randomized Controlled Trial
. 2025 Oct;7(10):2083-2098.
doi: 10.1038/s42255-025-01381-z. Epub 2025 Oct 7.

Effect of sweeteners and sweetness enhancers on weight management and gut microbiota composition in individuals with overweight or obesity: the SWEET study

Affiliations
Randomized Controlled Trial

Effect of sweeteners and sweetness enhancers on weight management and gut microbiota composition in individuals with overweight or obesity: the SWEET study

Michelle D Pang et al. Nat Metab. 2025 Oct.

Abstract

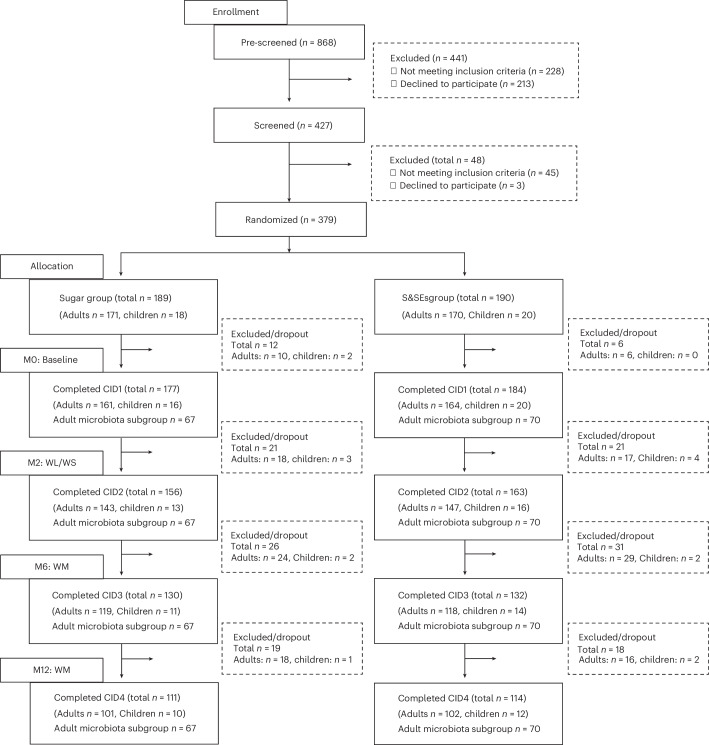
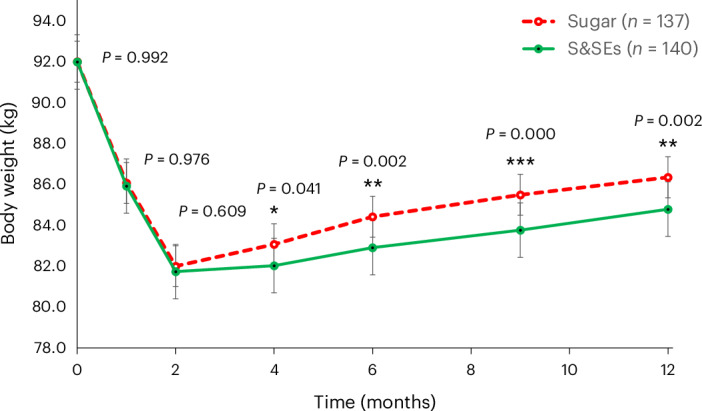
Consumption of sweeteners and sweetness enhancers (S&SEs) is a popular strategy to reduce sugar intake, but the role of S&SEs in body weight regulation and gut microbiota composition remains debated. Here, we show that S&SEs in a healthy diet support weight loss maintenance and beneficial gut microbiota shifts in adults with overweight or obesity. In this multi-centre, randomized, controlled trial, we included 341 adults and 38 children with overweight or obesity. Adults followed a 2-month low-energy diet for ≥5% weight loss, followed by a 10-month healthy ad libitum diet with <10% energy from sugars. One group replaced sugar-rich products with S&SE products (S&SEs group), while the other did not (sugar group). Primary outcomes included changes in body weight and gut microbiota composition at 1 year. Secondary outcomes included changes in cardiometabolic parameters. The S&SEs group, compared to the sugar group, maintained greater weight loss at 1 year (1.6 ± 0.7 kg, P = 0.029) and exhibited distinct gut microbiota shifts, with increased short-chain fatty acid and methane-producing taxa (q ≤ 0.05). No significant differences were observed in cardiometabolic markers or in children. Overall, our findings indicate that prolonged consumption of S&SEs in a healthy diet is a safe strategy for obesity management. ClinicalTrial.gov identifier: NCT04226911 .


Conflict of interest statement

Competing interests: A.R. has received honoraria from Nestlé, Unilever and the International Sweeteners Association and is currently employed by Novo Nordisk. J.C.G.H. and J.H. have received project funds from the American Beverage Association. T.L. works for a company (NetUnion) that has no conflict of interest in the trial outcome. C.E.H.’s research centre provides consultancy to, and has received travel funds to present research results from, organizations supported by food and drink companies. The remaining authors declare no competing interests.

Figures

Fig. 1
Fig. 1. Study participant flow chart.
Flow chart of participant enrollment, allocation, and follow-up in the study. A total of 868 individuals were pre-screened, with 379 randomized into two groups: the sugar group (n = 189) and the S&SEs group (n = 190). The figure shows exclusions, dropouts, and the number of adults and children completing each study visit (CID1–CID4) at baseline (M0), weight loss (WL)/weight stability (WS) (M2), mid-weight maintenance (WM) (M6), and after weight maintenance (M12), including the adult microbiota subgroup.
Fig. 2
Fig. 2. Body weight unadjusted means from M0 to M12 for the 277 adult participants who completed the weight loss period (M0–M2) with a weight loss ≥5% of initial body weight.
For the 74 adult participants who dropped out after successful weight loss, missing data are imputed by the last observation carried forward. Body weight was measured in the fasting state except at months 0.5, 1, 4 and 9. Statistical differences between groups were assessed using ANCOVA linear mixed models. Interaction time × group: P < 0.0001. Post hoc analyses: groups differ *P < 0.05; **P < 0.01; ***P < 0.001. Error bars, s.e.m. Source data
Fig. 3
Fig. 3. Microbial community composition.
Ordination plot of dbRDA using different dissimilarity metrics (Jaccard, P = 0.001; F = 2.427; R2 = 0.005; Bray–Curtis, P = 0.001; F = 1.948; R2 = 0.004; unweighted UniFrac, P = 0.001; F = 3.967; R2 = 0.008; and weighted UniFrac, P = 0.001; F = 3.923; R2 = 0.008). The first two constraint axes are plotted, and the amount of variation captured by an axis is displayed in parentheses after the axis name. Individual samples are represented by points; the shape corresponds to the collection time point (CID) and the colour corresponds to the intervention group; samples from the same individual but different CIDs are connected by a line. Black arrows show the direction and relative size of the variables’ influence on ordination. The significance of the interaction between time and group was tested with PERMANOVA, and results for each distance are indicated.
Fig. 4
Fig. 4. SCFA-producing genera.
Spaghetti plots depicting change in abundance over time for genera involved in SCFA production. a, Megamonas (β = 0.56, s.e. = 0.22, P = 0.0531). b, Megasphaera (β = 1.27, s.e. = 0.25, P < 0.0001). c, Dialister (β = 0.52, s.e. = 0.20; P = 0.0458). d, Catenibacterium (β = 0.68, s.e. = 0.21, P = 0.0110). e, Eubacterium eligens (β = 0.52, s.e. = 0.19, P = 0.0458). f, Lachnospiraceae ND3007 (β = 0.58, s.e. = 0.16, P = 0.0047). g, Prevotella (β = 0.90, s.e. = 0.20, P = 0.0002). h, Alloprevotella (β = 0.78, s.e. = 0.26, P = 0.0210). i, Porphyromonas (β = 0.75, s.e. = 0.24, P = 0.0183). j, Butyricimonas (β = 0.69, s.e. = 0.20, P = 0.0094). k, Saccharimonadales (β = −0.59, s.e. = 0.22, P = 0.0463). l, Candidatus Competibacter (β = −0.86, s.e. = 0.26, P = 0.0103). m, Oscillospira (β = 0.45, s.e. = 0.18, P = 0.0623). n, Clostridium sensu stricto 1 (β = −0.42, s.e. = 0.18, P = 0.0752). o, Eubacterium siraeum (β = 0.43, s.e. = 0.18, P = 0.0737). p, CAG:56 (β = 0.51, s.e. = 0.21, P = 0.0591). q, Methanolobus (CH4-producing; β = 1.61, s.e. = 0.31, P < 0.0001). The y axis shows CSS normalized and log-transformed read counts (abundance), and the x axis indicates time (month). Coloured by intervention groups, straight lines indicate the fit of a simple linear regression with corresponding 95% confidence intervals. The lines signify the mean of each group, with dashed lines and squares denoting the S&SEs group and solid lines and dots for the sugar group. Statistical importance of differences in trends between groups was tested with linear mixed-effect models as implemented in LinDa; outcomes are indicated above. P values adjusted using false discovery rate.
Fig. 5
Fig. 5. Results of random forest classification of responders and non-responders.
a, Receiver operating characteristic (ROC) curves for random forest models in which prediction was considerably better than chance. Facet labels indicate the index used to define responders or non-responders and the CID from which samples were used to build the model. ROC curve colours indicate the nature of the response variable used: green for the original definition of responders or non-responders, and red for a randomly assigned definition. b, Genera that significantly contributed to the classifications shown in a. If a genus was not taxonomically assigned, the lowest assigned taxonomic level was used as the name, preceded by a capital letter indicating the taxonomic rank. The x axis shows each taxon’s numeric contribution to classification, and the y axis lists the corresponding taxa. Facet labels indicate the classification group (Resp, responders; NonResp, non-responders) for which contribution was measured, or the mean decrease in accuracy (MDA) for the model overall. Bar colour reflects significance (P value); grey bars indicate no significant contribution. P values were estimated with a permutation test as implemented in the rfPermute package with no adjustment for multiple testing.
Extended Data Fig. 1
Extended Data Fig. 1. Classification of responders and body weight outcomes in adults and children across intervention groups.
a, Violin plots of body weight regain, fasting glucose, and HbA1c indices during the weight maintenance phase (CID4 – CID2), with participants in the Sugar and S&SEs groups classified as responders or non-responders. Body weight regain was reflected in a weight maintenance index = (weight at CID4 – weight at CID2)/(weight at CID1 – weight at CID2)). For body weight regain (left panel) and fasting glucose (middle panel), participants were split into five tertiles within both S&SEs and Sugar group. For HbA1c, participants with a shift above zero were considered non-responders; the rest were considered responders (right panel). The colour of the dots corresponds to the placement of a participant into the response (Resp), non-response (NonResp) group, or exclusion from the further analysis (NA). b, Boxplot of 1-y change in body weight (kg) of the completers in each of the intervention groups in adults. c, Boxplot of BMI-for-age (z-score) of completers in each intervention group in children. 1B; completers n = 203. Abbreviations: S&SEs, sweeteners and sweetness enhancers. Source data
Extended Data Fig. 2
Extended Data Fig. 2. Microbial genera with differential abundance trends between intervention groups over time.
Heat map of microbial genera (rows) CSS normalized and log2 transformed abundance per sample with significant different abundance trends over time between the intervention groups. Source data
Extended Data Fig. 3
Extended Data Fig. 3. Spaghetti plots of pathway analysis based on inferred by PICRUSt2 MetaCyc pathways.
Colored by intervention groups straight lines indicate the fit of a simple linear regression with corresponding 95% confidence intervals: red lines for the S&SEs group and blue lines for the Sugar group. The black lines signify the mean of each group, with dashed lines and squares denoting the S&SEs group and solid lines and dots for the Sugar group. Statistical importance of differences in trends between groups was tested with linear mixed effect models as implemented in LinDa and outcomes are indicated above. P-values adjusted using False Discovery Rate. Source data
Extended Data Fig. 4
Extended Data Fig. 4. Random Forest classification of responders vs non-responders.
(A) Receiver operating characteristic (ROC) curves based on Random Forest classification of responders and non-responders, (B) Dot plots of the Area under the curve (AUC) based on Random Forest classification of responders and non-responders Responder and non-responders were defined by changes in HbA1c, fasting glucose, or weight maintenance index (as indicated in grid row names), (A)Treatment group and CID are indicated in the grid column names (B) CID is indicated in the grid columns names and treatment group in the x-axis labels The colour of ROC curves or dots corresponds to the order of the response variable used to build the prediction model: green - original definition of the responders/non-responders; red – definition of the responders/non-responders is random.

References

    1. Smith, K. & Smith, M. Obesity statistics. Prim. Care43, 121–135 (2016). - PubMed
    1. Fruh, S. Obesity: risk factors, complications, and strategies for sustainable long-term weight management. J. Am. Assoc. Nurse Pr.29, S3–S14 (2017).
    1. Statovci, D., Aguilera, M., MacSharry, J. & Melgar, S. The impact of Western diet and nutrients on the microbiota and immune response at mucosal interfaces. Front. Immunol.8, 838 (2017). - PMC - PubMed
    1. World Health Organization. Use of Non-Sugar Sweeteners: WHO Guideline (2023).
    1. Sluik, D., van Lee, L., Engelen, A. & Feskens, E. Total, free, and added sugar consumption and adherence to guidelines: the Dutch National Food Consumption Survey 2007–2010. Nutrients8, 70 (2016). - PMC - PubMed

Publication types

Substances

Associated data