. 2025 Oct 7;23(1):418.
doi: 10.1186/s12964-025-02382-x.

Endothelial cell-derived apoptotic bodies modulate innate and adaptive immune responses during inflammation

Affiliations

Endothelial cell-derived apoptotic bodies modulate innate and adaptive immune responses during inflammation

Caitlin L Vella et al. Cell Commun Signal. .

Abstract

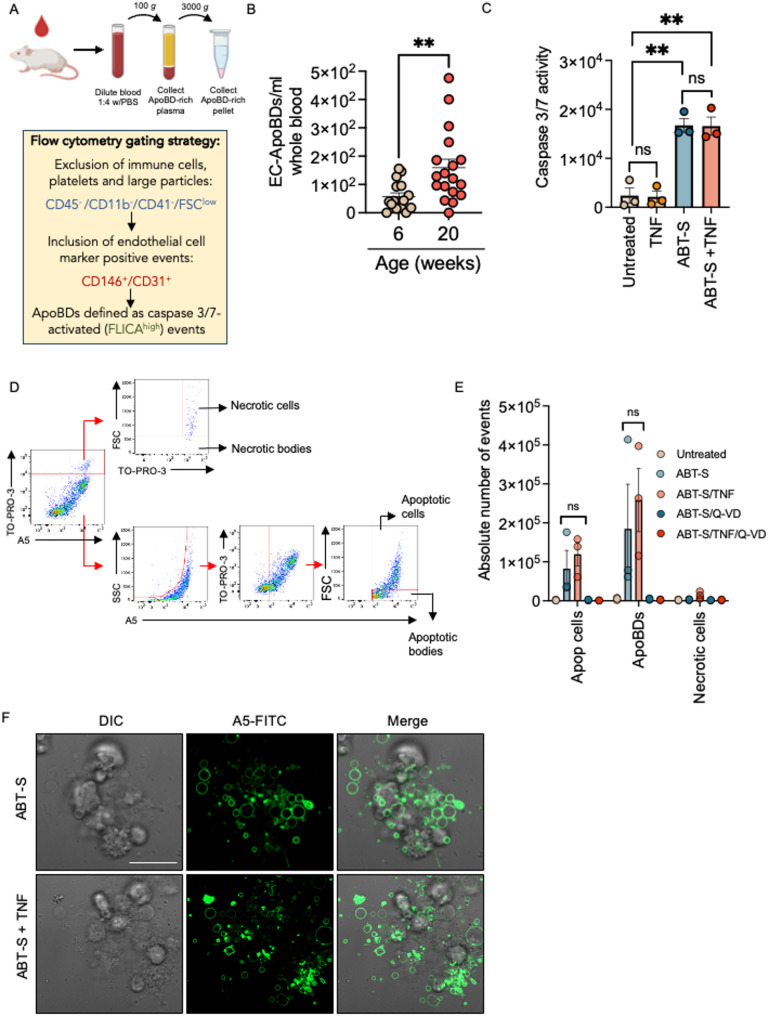
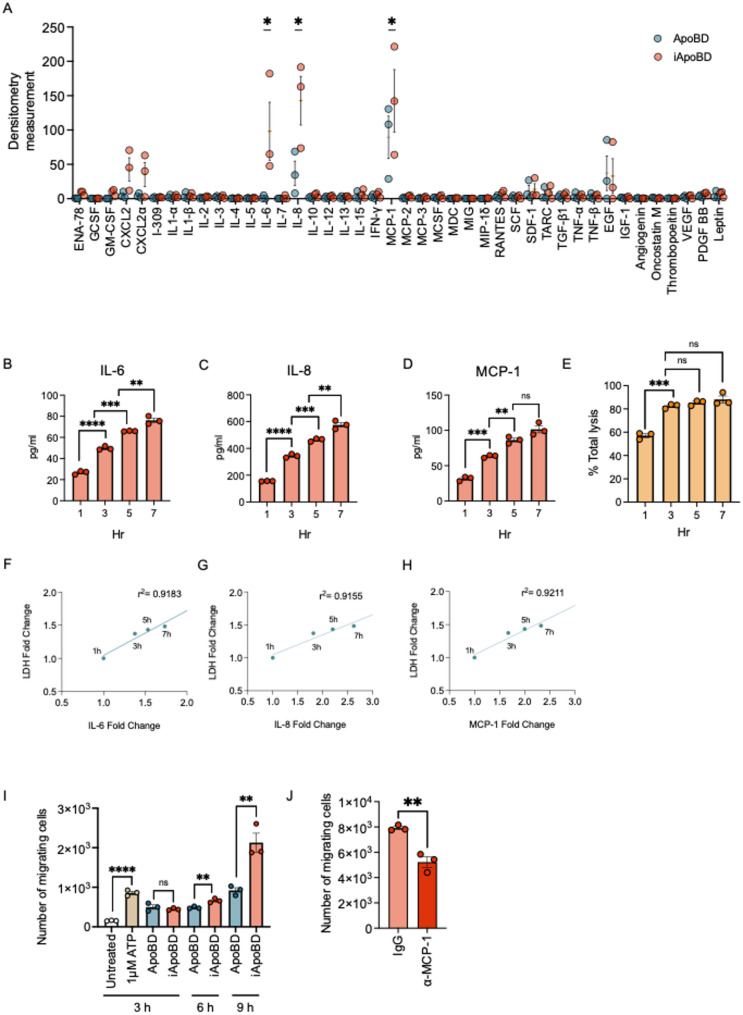
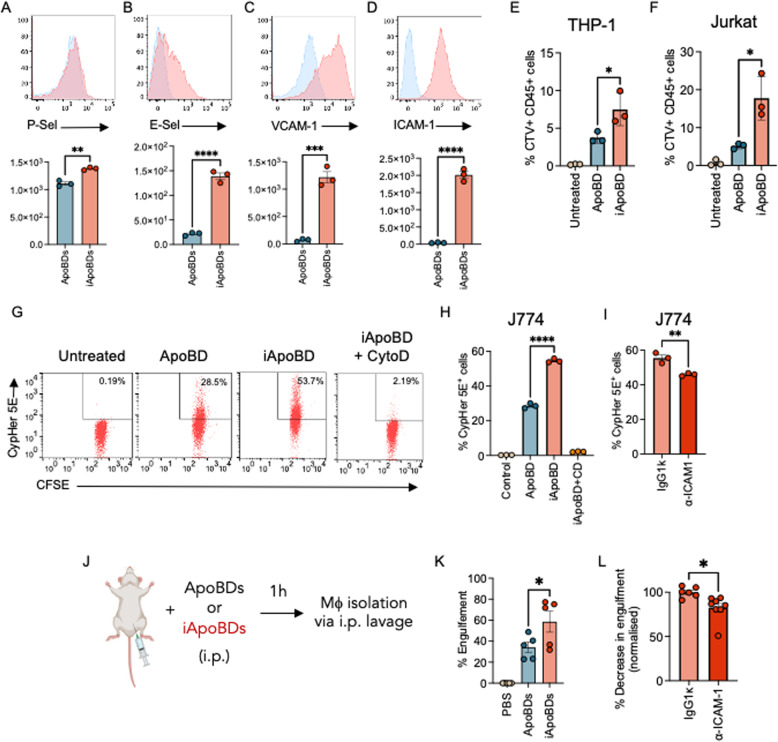
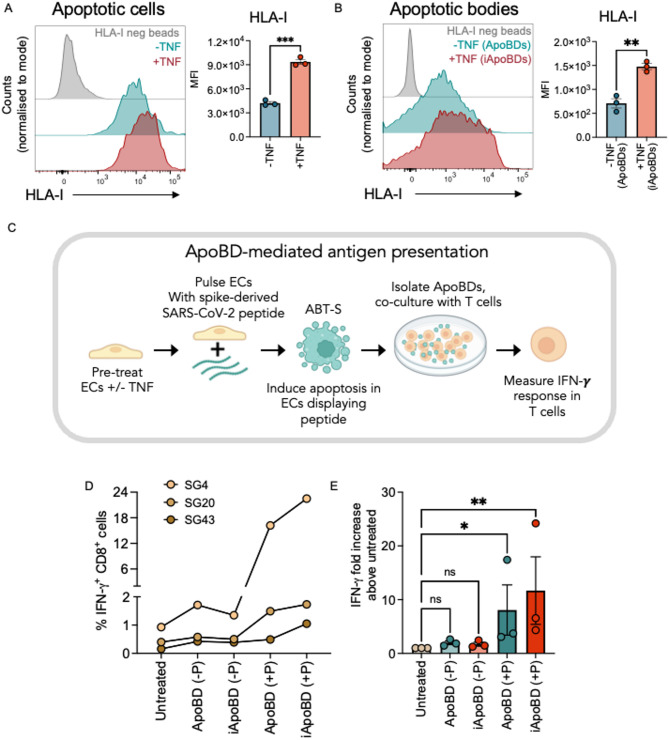
Endothelial cells (ECs) act as gatekeepers and signalling hubs that coordinate communication between blood vessels and surrounding tissues by regulating vascular tone, immune responses and numerous other physiological processes. During vascular inflammation commonly associated with aging, atherosclerosis, diabetes and autoimmunity, a range of biological, environmental and physical stressors can induce activation and apoptosis of ECs. Apoptotic bodies (ApoBDs) are large (~ 1-5 μm), membrane‑bound extracellular vesicles generated solely through apoptotic cell disassembly, that are increasingly recognised as mediators of intercellular communication via the transfer of bioactive molecules to target cells. Although EC apoptosis is a central feature of vascular inflammatory disorders, the formation of EC‑derived ApoBDs and their immunomodulatory roles when formed in an inflammatory environment, remains poorly defined. This study aimed to characterise the functional properties of EC‑derived ApoBDs generated under inflammatory conditions in vitro. A proteomics analysis of EC‑derived ApoBDs revealed that EC‑ApoBDs generated during inflammation ('iApoBDs') were enriched in inflammatory cytokines/chemokines, adhesion molecules and antigen presentation machinery compared with non-inflammatory ('ApoBD') controls. Functionally, iApoBDs promoted monocyte chemotaxis via the release of MCP-1, while altered expression of the adhesion molecule ICAM-1 enhanced efferocytosis by macrophages in vitro and in vivo. Furthermore, iApoBDs generated from antigen-pulsed HUVECs promoted IFN‑𝛾 expression by peptide specific CD8 T cells in an in vitro model of antigen presentation. These findings demonstrate that within an inflammatory setting, apoptotic ECs can participate in continued communication with their environment via the generation of ApoBDs, thereby modulating innate and adaptive immune processes. The formation of ApoBDs by ECs may serve as a target for therapeutic interventions in inflammatory vascular diseases.

Keywords: Apoptosis; Apoptotic bodies; Efferocytosis; Endothelial cells; Extracellular vesicles; Inflammation.


Conflict of interest statement

Declarations. Competing interests: The authors declare no competing interests.

Figures

Fig. 1
Fig. 1
Endothelial cells generate apoptotic bodies in vitro and in vivo under homeostatic and inflammatory conditions. A Schematic diagram illustrating differential centrifugation method of EC-ApoBD-rich plasma preparation from whole mouse blood (top) and flow cytometry-based gating strategy to identify EC-ApoBD population (boxed). B Concentration of EC-ApoBDs/mL whole blood in 6- vs. 20-week old WT C57Bl/6 mice, via flow cytometry-based plasma analysis in (A), error bars represent mean ± S.E.M, n = 18. Normality was tested using the Shapiro–Wilk test; as data were not normally distributed, a non-parametric Mann–Whitney test was used. ** = P<0.01. C Level of caspase 3/7 activity in ABT-S-treated HUVECs ± TNF (50 ng/mL), determined via Caspase‑Glo 3/7 assay, n = 3. D Gating strategy of flow cytometry based cell death assay. HUVECs pre‑treated with pan-caspase inhibitor Q‑VD‑OPh (50 µM) before inducing apoptosis in the presence and absence of TNF (50 ng/mL). Samples were stained with A5‑FITC and TO‑PRO‑3 to identify necrotic cell, apoptotic cell and ApoBD populations. E Quantification of the absolute number of apoptotic cells, ApoBDs and necrotic cells from (D). Error bars represent mean ± S.E.M. (n = 3). P‑values in (B), (C) and (E) were determined using unpaired student’s two tailed t‑test, ns = not significant, ** = P<0.01. F ABT-S-treated HUVECs ± TNF (50 ng/mL) imaged at 2 h post apoptosis induction, monitored by confocal laser scanning microscopy. PtdSer exposure determined by A5‑FITC (green) membrane staining. Data is representative of three independent experiments
Fig. 2
Fig. 2
Endothelial cell-derived apoptotic bodies generated under inflammatory conditions display enrichment of immunomodulatory proteins. A Schematic diagram of isolation procedure to obtain ApoBD and iApoBDs by differential centrifugation. B Representative flow cytometry plots demonstrating enrichment of small (FSClow) particles in ‘whole apoptotic sample (WAS)’ compared to ApoBD-enriched samples following isolation protocol. Data is representative of three independent experiments. C Quantification FSClow particles from (B). D Representative micrographs of isolated ApoBDs/iApoBDs stained with TO-PRO-3 and A5-FITC. Scale bar = 5 μm. E Quantification of vesicle size distribution from (D), based on 5 × 5 tile regions. Normality was tested using the Shapiro–Wilk test; as data were not normally distributed, a non-parametric Mann–Whitney test was used, ns = not significant. Data are representative of 3 independent experiments. F Percentage of PtdSer positive particles in ApoBD-rich samples following ApoBD isolation protocol, determined by A5-FITC staining, n = 3. G Detection of apoptosis markers PANX1 (pannexin 1) and caspase 3 in WAS and ApoBD fractions of ABTS-treated HUVECs ± TNF, compared to untreated HUVECs. Data is representative of three independent experiments. H Heatmap illustrating significantly enriched proteins (> 1.5-fold) in iApoBDs compared to ApoBDs from non-biased proteomics screen of HUVEC ApoBD lysates. The cutoffs for significance were an alpha of 0.05 (P-value). Enlarged box shows selected enriched proteins examined in subsequent experiments. Three biological replicates were collected. I Individual Log2 protein abundance scores for selected proteins from (H). in (I), error bars represent mean ± S.E.M., P-values were determined for individual proteins using unpaired student’s two tailed t-tests, **** = P>0.0001
Fig. 3
Fig. 3
iApoBDs release cytokines/chemokines over time and promote monocyte chemotaxis. A Densitometry analysis measuring 42 cytokines from ApoBDs and iApoBDs lysates by immunoblot-based cytokine antibody array. Error bars = S.E.M, asterisks represent q-value (FDR-adjusted p-value) discoveries from multiple unpaired t-tests, n = 3. B-D Supernatant concentrations of IL-6 (B), IL-8 (C) and MCP-1 (D), as determined by cytometric bead array following incubation of iApoBDs for 1, 3, 5 and 7 h, n = 3. E Percentage of iApoBD membrane lysis, represented as a proportion of positive control (cell lysis buffer), determined by LDH cytotoxicity assay, n = 3. F-H Correlation between fold change in iApoBD membrane lysis and IL-6 (F), IL-8 (G) or MCP-1 (H) release from iApoBDs, determined by linear regression analysis. Data points represent mean values, n = 3. I THP-1 cell migration towards ApoBDs or iApoBDs across 3, 6 and 9 h, compared to ATP (1 μM) positive control, determined by Transwell migration assay. Data representative of three independent experiments. J THP-1 cell migration towards iApoBDs in the presence of MCP‑1 neutralising antibody (25 µg/mL) or IgG isotype control over 9 h. Data is representative of three independent experiments. B-E, I-J Error bars represent mean ± S.E.M., P‑values were determined using unpaired student’s two tailed t‑test, ns = not significant, ** = P<0.01, *** = P<0.001, **** = P<0.0001
Fig. 4
Fig. 4
iApoBDs display enhanced adhesion to immune cells and promote efferocytosis in vitro and in vivo in an ICAM-1-dependent manner. A-D Surface expression of adhesion molecules P-selectin (A), E-selectin (B), VCAM-1 (C) and ICAM-1 (D) on ApoBDs vs. iApoBDs, determined by flow cytometry-based immunofluorescence. Upper: histogram shift in mean fluorescence intensity (MFI); Lower: quantification in bar graphs. Data represent three independent experiments. E Adhesion of CTV-labelled ApoBDs and iApoBDs to CD45+ THP-1 monocytes, determined via static adhesion assay and analysed by flow cytometry, n = 3. F Adhesion of CTV-labelled ApoBDs and iApoBDs to CD3+ Jurkat T cells, determined as in (E), n = 3. G Representative flow cytometry plots of engulfment of CypHer 5E-labelled ApoBDs and iApoBDs by CTV-labelled J774 mouse macrophages compared to untreated control or in the presence of Cytochalasin D (CD, 5 µM) in vitro; H Quantification of (G) in bar graph. I in vitro engulfment of iApoBDs by J774 cells in the presence of ICAM-1 (10 µg/mL) neutralising antibody or isotype control. Data represents three independent experiments. J Schematic diagram of in vivo intraperitoneal engulfment assay. K in vivo engulfment of Cypher 5E-stained ApoBDs and iApoBDs by CD45+/F4/80+ intraperitoneal mouse macrophages, n = 5. L in vivo intraperitoneal engulfment assay of iApoBDs in the presence of ICAM-1 neutralising antibody (10 µg/mL) or isotype control, n = 6–8, merged from two independent experiments. A-D, E Error bars represent mean ± S.E.M., P‑values were determined using unpaired student’s two tailed t‑test, ns = not significant, * = P<0.05, ** = P <0.01, **** = P< 0.0001
Fig. 5
Fig. 5
iApoBDs promote IFN-γ production in CD8++ T cells via direct antigen presentation. A-B HLA-I expression on (A) apoptotic HUVEC cells and (B) ApoBDs/iApoBDs following ABT-S treatment ± TNF, determined by flow cytometry-based immunofluorescence. In (A) and (B), data is shown as histogram shift in mean fluorescence intensity (MFI) (left) and quantification in bar graphs (right); Error bars represent mean ± S.E.M., P‑values were determined using unpaired student’s two tailed t‑test, nn = 3. C Schematic diagram of SARS‑CoV‑2 peptide antigen presentation by single donor HUVEC ApoBDs and iApoBDs: ApoBDs/iApoBDs pulsed with the ‘YLQ’ peptide were co-cultured with donor T cells and IFN‑ γ expression was determined. D Activation levels of CD8++ T cells, determined by flow cytometry-based IFN‑𝛾 staining per donor, nn = 3. E Data from (D) displayed as fold increase of IFN‑𝛾 expression above untreated. Error bars represent mean ± S.E.M, P‑values were determined using Kruskal‑Wallis test, n = 3. B, E P‑values indicate ns = not significant, * = P<0.05, ** = P<0.01

References

    1. Li Y, et al. Dynamics of endothelial cell generation and turnover in arteries during homeostasis and diseases. Circulation. 2024;149:135–54. - PubMed
    1. Dobner S, Tóth F, de Rooij LP. M. H. A high-resolution view of the heterogeneous aging endothelium. Angiogenesis. 2024;27:129–45. - PMC - PubMed
    1. Paone S, Baxter AA, Hulett MD, Poon IK. H. Endothelial cell apoptosis and the role of endothelial cell-derived extracellular vesicles in the progression of atherosclerosis. Cell Mol Life Sci. 2019;76:1093–106. - PMC - PubMed
    1. Volpe CMO, Villar-Delfino PH, dos Anjos PMF, Nogueira-Machado JA. Cellular death, reactive oxygen species (ROS) and diabetic complications. Cell Death Dis. 2018;9:1–9. - PMC - PubMed
    1. Rajagopalan S, et al. Endothelial cell apoptosis in systemic lupus erythematosus: a common pathway for abnormal vascular function and thrombosis propensity. Blood. 2004;103:3677–83. - PubMed

LinkOut - more resources