. 2025 Oct 7;23(1):1058.
doi: 10.1186/s12967-025-06819-2.

Neutrophil extracellular trapping network-associated biomarkers in liver fibrosis: machine learning and experimental validation

Affiliations

Neutrophil extracellular trapping network-associated biomarkers in liver fibrosis: machine learning and experimental validation

Yanbo Li et al. J Transl Med. .

Abstract

Background: The diagnostic and therapeutic potential of neutrophil extracellular traps (NETs) in liver fibrosis (LF) has not been fully explored. We aim to screen and verify NETs-related liver fibrosis biomarkers through machine learning.

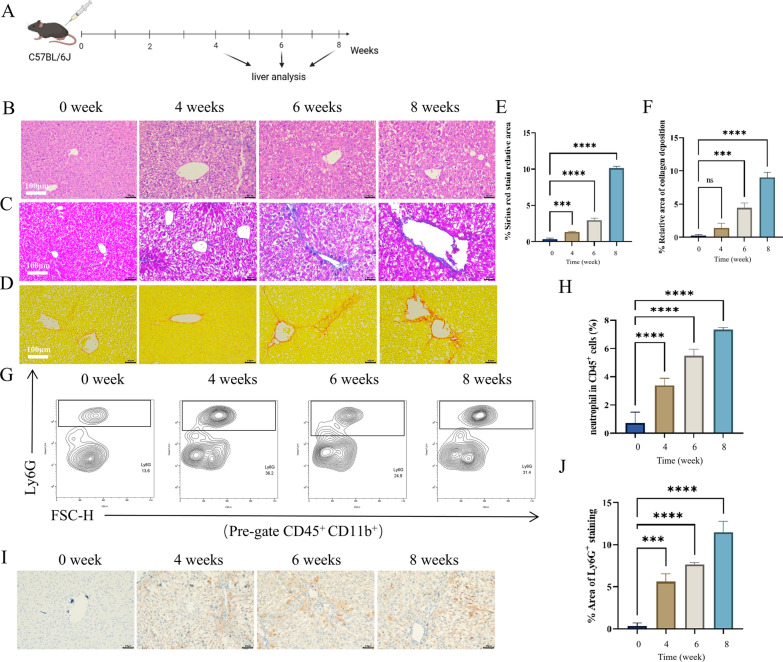
Methods: In order to obtain NETs-related differentially expressed genes (NETs-DEGs), differential analysis and WGCNA analysis were performed on the GEO dataset (GSE84044, GSE49541) and the NETs dataset. Enrichment analysis and protein interaction analysis were used to reveal the candidate genes and potential mechanisms of NETs-related liver fibrosis. Biomarkers were screened using SVM-RFE and Boruta machine learning algorithms, followed by immune infiltration analysis. A multi-stage model of fibrosis in mice was constructed, and neutrophil infiltration, NETs accumulation and NETs-related biomarkers were characterized by immunohistochemistry, immunofluorescence, flow cytometry and qPCR. Finally, the molecular regulatory network and potential drugs of biomarkers were predicted.

Results: A total of 166 NETs-DEGs were identified. Through enrichment analysis, these genes were mainly enriched in chemokine signaling pathway and cytokine-cytokine receptor interaction pathway. Machine learning screened CCL2 as a NETs-related liver fibrosis biomarker, involved in ribosome-related processes, cell cycle regulation and allograft rejection pathways. Immune infiltration analysis showed that there were significant differences in 22 immune cell subtypes between fibrotic samples and healthy samples, including neutrophils mainly related to NETs production. The results of in vivo experiments showed that neutrophil infiltration, NETs accumulation and CCL2 level were up-regulated during fibrosis. A total of 5 miRNAs, 2 lncRNAs, 20 function-related genes and 6 potential drugs were identified based on CCL2.

Conclusions: This study identified CCL2 as a biomarker for nets-related liver fibrosis, providing a new perspective for understanding the mechanisms of nets-mediated fibrosis and promoting therapeutic discovery.

Keywords: Bioinformatics; Liver fibrosis; Machine learning; NETs.


Conflict of interest statement

Declarations. Ethics approval and consent to participate: Animal experiments for this study were approved by the Institutional Animal Care Committee of Guanganmen Hospital (IACUC-2025-103-SQ). Consent for publication: Not applicable. Competing interests: The authors declare that they have no competing interests.

Figures

Fig. 1
Fig. 1
Research idea map
Fig. 2
Fig. 2
Screening of DEGs for liver fibrosis and identification of NETs-related modules. A Volcano plot of DEGs. B Heatmap of DEGs. C NETs scoring violin chart. D Sample clustering diagram. ****P < 0.0001. E Module dynamic clipping tree. F Heatmap of Module and NETs Score Correlation. G Key Module Gene GS, MM Correlation Scatter Plot. The horizontal coordinate is MM, representing the correlation between the gene and the module in which it is located, and the vertical coordinate is GS, representing the correlation between each gene in the representative module and the trait
Fig. 3
Fig. 3
Differential gene screening and functional analysis of NETs-associated liver fibrosis. A Venn figure. B GO enrichment analysis of NETs-DEGs. C KEGG chordal maps of NETs-DEGs. D PPI network of NETs-DEGs. E CCL5 PPI network. F CCL2 PPI network
Fig. 4
Fig. 4
Machine Learning Screening for Biomarkers. A Results of the Boruta algorithm for candidate gene analysis. Color distinguishes the importance level of features: green indicates important features, red indicates unimportant features, and yellow indicates unclear important features. The blue box represents the minimum, average and maximum Z values of the shadow feature. B SVM-RFE analysis results. C, D Results of the analysis of variance for CCL2, NCF1. *P < 0.05, **P < 0.01, ***P < 0.001, ****P < 0.0001. E Chromosomal localization map of CCL2. F Trend plot of GSEA enrichment of CCL2
Fig. 5
Fig. 5
Immune infiltration analysis. A Immune cell score heatmap. B Boxplot of immune cell scores. C Immune cell correlation analysis
Fig. 6
Fig. 6
Neutrophil levels increase with increasing liver fibrosis. A Schematic diagram of modeling scheme and experimental grouping. Mice were injected intraperitoneally with CCL4 twice weekly and animals were euthanized after 4, 6, or 8 weeks. B, D Results of HE, Massion, and Sirius red staining of mouse liver tissues (n = 6). E, F Quantitative analysis of Massion and Sirius Red staining results. G-H Flow cytometry results and quantitative analysis of neutrophils from mouse liver tissu (n = 4). I-J Immunohistochemical results and quantitative analysis of the neutrophil marker Ly6G (n = 6). *P < 0.05, **P < 0.01, ***P < 0.001, ****P < 0.0001
Fig. 7
Fig. 7
Markers of NETs and CCL2 increase with progression of liver fibrosis. AC Immunohistochemical results of MPO, α-SMA, CCL2 (n = 6). D Immunofluorescence co-localization results of NE and α-SMA (n = 6). EG Quantitative analysis of immunohistochemical results for MPO, α-SMA, and CCL2 (n = 6). H Quantitative analysis of the mean fluorescence intensity of NE (n = 6). IK qPCR results of MPO, NE, and CCL2 (n = 6). *P < 0.05, **P < 0.01, ***P < 0.001, ****P < 0.0001
Fig. 8
Fig. 8
Biomarker CCL2 ceRNA, GeneMANIA analysis and drug prediction. A The molecular regulatory network of CCL2. B GeneMANIA Database Analysis Network Diagram. C Drug prediction result

References

    1. Berumen J, Baglieri J, Kisseleva T, Mekeel K. Liver fibrosis: pathophysiology and clinical implications. WIREs Mech Dis. 2021;13(1):e1499. - PMC - PubMed
    1. Bataller R, Brenner DA. Liver fibrosis. J Clin Invest. 2005;115(2):209–18. - PMC - PubMed
    1. Kisseleva T, Brenner D. Molecular and cellular mechanisms of liver fibrosis and its regression. Nat Rev Gastroenterol Hepatol. 2021;18(3):151–66. - PubMed
    1. Asrani SK, Devarbhavi H, Eaton J, Kamath PS. Burden of liver diseases in the world. J Hepatol. 2019;70(1):151–71. - PubMed
    1. Tu H, Ren H, Jiang J, Shao C, Shi Y, Li P. Dying to defend: neutrophil death pathways and their implications in immunity. Adv Sci. 2024;11(8):e2306457. - PMC - PubMed

Publication types

LinkOut - more resources