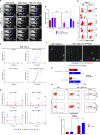
. 2025 Sep 22:16:1593913.
doi: 10.3389/fimmu.2025.1593913. eCollection 2025.

CD8+ T-NK cell crosstalk establishes preemptive immunosurveillance to eliminate antigen-escape tumors

Affiliations

CD8+ T-NK cell crosstalk establishes preemptive immunosurveillance to eliminate antigen-escape tumors

Roman V Uzhachenko et al. Front Immunol. .

Abstract

Background and objective: Tumor antigen-escape variants undermine immunotherapy by subverting lymphocyte effector functions and reshaping tumor-immune dynamics. It is essential to delineate functional interplay within immune networks during tumor progression. We investigated whether homeostatic crosstalk between CD8+T cells and natural killer (NK) cells preempts tumor antigen-escape.

Methods: Adoptive CD8+T cell transfers were administered before (D-7, homeostatic pre-priming) or after (D+1) tumor establishment in Rag1-/- and Rag1-/-γc-/- mice. Antigen presentation, immune activation, proliferation, cytotoxicity, and memory were quantified by flow cytometry, live bioluminescence and confocal imaging. Monoculture, co-culture, and a 3D silica nanofiber carpet mimicking basement-membrane-like topography modeled intercellular interactions. Signaling arrays and motion metrics (Speed-Distance Index, deceleration) were conducted. Human ligand-receptor pairs engaged in CD8+T-NK crosstalk were probed in silico.

Results and discussion: Pre-tumor D-7 CD8+T cell transfer completely suppressed antigen-escape tumors with NK cells as major effectors showing elevated CD25, CD69, CD107a, and GzmB, marking activated and effector phenotype, and promoting central-memory CD62L⁺CD44⁺CD8⁺TCM precursors. By contrast, post-tumor D+1-transferred CD8+T cells allowed emergence of tumor variants resistant to antigen-specific cytolysis as assessed on day 25, despite those T cells retaining higher intrinsic cytotoxic capacity than the D-7 T cell cohort. Mechanistically, CD8+T and NK cells formed stable contacts through pseudopodial intercellular nanotubes enabling bidirectional membrane exchange and signaling via STAT, Akt, and mTOR pathways, augmenting NK effector function and promoting CD8+TCM differentiation. In silico analysis identified human ligand-receptor pairs engaged in CD8+T-NK adhesion, stimulatory and regulatory axes, including CD200-CD200R, PD-L1-PD-1, and CD18/CD11a-DNAM-1 (CD226). Together, data support a three-phase model of preemptive immunosurveillance initiated by early CD8⁺T-NK crosstalk.

Conclusion: Homeostatic conditioning and effector cooperativity between CD8+T and NK cells protect against tumor immune escape. The findings uncover a mechanistic axis of preemptive immunosurveillance that lays the foundation for next-generation preventive immunotherapies to control antigen-escape tumors.

Keywords: CD8+ T lymphocytes; T cell–NK cell cooperativity; adoptive cell transfer; antigen-loss variants; cancer immunotherapy; membranous tunneling nanotubes; preemptive immunosurveillance; tumor immune escape.


Conflict of interest statement

Authors TS and AS were employed by Science Applications International Corporation, Inc., and Leidos Biomedical Research, Inc. The remaining authors declare that the research was conducted in the absence of any commercial or financial relationships that could be construed as a potential conflict of interest.

Figures
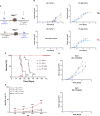
Figure 1
Figure 1
Pre-tumor adoptive T cell transfer enables immunosurveillance against tumor development and antigen escape in mice. (A) Designs of T cell transfer protocols are shown where Rag1 −/−B10.D2 mice were reconstituted with 5 x 10⁶ TCRP1ACD8+T cells 7 days (D−7) before or one day (D+1) after the subcutaneous injection of 1 x 10⁶ P1A+P511 or P1AP1.204 tumor cells. (B, C) P511 or P1.204 tumor growth was monitored. Individual tumor growth kinetics (B) from one representative experiment, n = 5–7 mice per group, and Kaplan-Meier survival curves (C) from four experiments are presented. Numbers in parentheses depict median survival in days. n = 22 mice per group, p≤ 0.001 (two-sided log-rank test) for D−7 protocol in mice with P511 tumors compared with other groups. (D) TCRP1ACD8+T cell cytolytic assay against P511 or P1.204 tumor cells growing out at day 25 following D+1 transfer of T cells in comparison with P511 tumor cells isolated at day 14 from Rag1 −/−B10.D2 mice without T cell transfer. Purified TCRP1ACD8+T cells were stimulated in vitro for 3 days with syngeneic wt T-depleted splenic APCs loaded with the relevant cognate P1A35–43 peptide (LPYLGWLVF) and incubated with target cells for 5.5 h before analysis. ***, p≤ 0.001 (two-sided unpaired t-test) relative to other groups. (E) Tumor growth kinetics in TCRP1A Rag1 −/−B10.D2 mice of re-inoculation of outgrowing P511 tumor cells isolated at day 25 following D+1 transfer of TCRP1ACD8+T cells in comparison with P511 cells harvested from Rag1 −/−B10.D2 mice without T cell transfer, n = 5.
Figure 2
Figure 2
Direct P1A antigen presentation by tumor cells efficiently triggers CD8+T cell proliferation and elicits cytotoxic activity. (A) T cell proliferation is shown when naïve CFSE-labeled TCRP1ACD8+T cells (0.5 x 10⁶) were cultured with indicated numbers of irradiated (20 Gy) tumor cells with or without 0.5 x 10⁶ syngeneic dendritic cells. Bar graphs: Quantitative summary of proliferation frequencies (%) per generation (red: proliferating; blue: non-proliferating cells) from histograms; Data represent mean ± SEM; n=2. The same number of dendritic cells loaded with or without 10−7 M P1A35–43 peptide (P1Ap) were used as controls. (B) Cytolytic activity against P1A+P511 and P1AP1.204 targets are shown for CD8+T cells harvested from 1 x 10³ P511 co-culture with or without DC and compared to the P1A-deficit targets, n=3. *, p ≤ 0.05; ***, p ≤ 0.001. (C) The outcome of P1A tumor Ag presentation in-vivo is shown by T cell proliferation in tumor-draining lymph nodes (TDLN) and contralateral lymph nodes (CLN) on day two measured by CFSE divisions in P511 mismatched Rag1−/−B6 mice, with the possibility of only direct presentation of P1A by injected tumor cells or in P511 syngeneic Rag1−/−B10.D2 mice, where both direct as well as cross-presentation via host APCs could occur. Rag1−/−B6 and Rag1−/−B10.D2 mice were infused with CFSE-labeled TCRP1ACD8+T cells (5 x 10⁶) 7 days after the subcutaneous injection of 1 x 10⁶ P1A+P511 or P1AP1.204 tumor cells. Quantification of proliferation frequencies (%) in Rag1-/- B6 mice and Rag1−/−B10.D2 is presented; n=2. Data are representative of at least two independent experiments. Values in the bar graphs are represented as mean ± SD.
Figure 3
Figure 3
CD8+T cells following the pre– and post–tumor transfers exhibit comparable activation and memory effector function. (A) Representative flow cytometry plots showing co-expression of activation (CD25) and effector (IFNγ) markers on gated TCRP1ACD8+ T cells in tumor-draining lymph nodes (TDLN) and contralateral lymph nodes (CLN) from Rag1-/- B10.D2 mice, comparing D–7 and D+1 transfer protocols 3 days after tumor injection. Quadrants indicate percentages of positive populations. (B) Bar graph showing the population frequency (%) of CD25+ IFNγ- and CD25+ IFNγ+ in CD8+T cells from CLN, TDL and spleen; Data represent mean ± SEM; n=2. (C) Corresponding analysis of CD44 and CD62L expression 25 days after tumor injection is shown on gated H2-Ld:P1A tetramer+ T cells in the CLN, TDLN and spleens of Rag1−/− B10.D2 mice that were infused with 5 x 10⁶ TCRP1ACD8+T cells 7 days (D−7) before or one day (D+1) after s.c. injection of 1 x 10⁶ P1A+P511 or P1AP1.204 tumor cells. (D) Bar graph showing the population frequency (%) of CD44+ CD62L- and CD44+ CD62L+ in CD8+T cells from CLN, TDLN and spleen; Data represent mean ± SEM; n=2. *, p ≤ 0.05; ***, p ≤ 0.001. (E) Ex-vivo cytolytic activity against P1A+ targets is shown for the CLN and TDLN cells harvested on day 25 post-tumor from P1A+P511 or P1AP1.204 tumor-injected mice infused with D+1 or D−7 TCRP1ACD8+T cell transfers. *, p≤ 0.05 (two-sided unpaired t-test) relative to CD8+T cells harvested from P1AP1.204 tumor-bearing mice. Data are representative of two independent experiments.
Figure 4
Figure 4
CD8+T cells enhance NK cell granzyme B expression to prevent tumor escape. (A) Bioluminescence imaging of tumor growth in Rag1 −/−B10.D2 or Rag1 −/−γc−/−B10.D2 mice injected s.c. with 1 x 10⁶ P1A+P511 (right flank, R) and 1 x 10⁶ P1A−P1.204-Luc (left flank, L), or a mixture of 1 x 10⁶ P1A+P511 and 1 x 10⁶ P1AP1.204-Luc (R), or 2 x 10⁶ P1A+P511-Luc (R). All mice had received an i.v. transfer of 2 x 10⁶ TCRP1ACD8+T cells 5 days earlier (D−5). (B) Bar graph displaying the summary of luciferase bioluminescence intensities calculated by mean tumor area (pixels), reflecting tumor growth and cytotoxic response. ***, p ≤ 0.001. (C) Tumor growth curves of individual Rag1 −/−B10.D2 mice injected with the P511 and/or P1.204 tumor cells under four different flank conditions: 1. P511 (R): 1 x 10⁶ P511 cells injected into the right flank only. 2. P511 (R) + P1.204 (L): 1×10⁶ P511 cells on the right flank and 1 x 10⁶ P1.204 cells on the left flank. 3. P511 + P1.204 (R): 1 x 10⁶ P511 and 1 x 10⁶ P1.204 cells co−injected into the right flank. 4. P511 + P1.204 (R) + Anti−NK1.1: Co−injection as in (3), followed by NK cell depletion via anti−NK1.1 antibody treatment to confirm NK cell dependency. Each colored line represents the tumor volume (mm2) in a single mouse over time (days post−implantation). Tumor volumes were measured every 3–4 days. Data are representative of two independent experiments (n = 5 mice per group). (D) Transferred TCRP1ACD8+T cell localization and proliferation as read by CFSE divisions on day two post transfer is shown in PBL, LN, spleen, liver, and lung. (E) Proportions of CD8+ and NK1.1+ cells are shown at 18h, and on day 3 and 5 post-transfer in the indicated tissues of Rag1 −/−B10.D2 or Rag1 −/−γc−/−B10.D2 mice; Data are mean ± SEM (n = 3–5 mice per group per timepoint). (F) Endogenous Tomato fluorescence corresponding to the GzmB-tdTom (GzmB) protein expression and co-staining with anti-NKp46 and anti-CD8 is mAb shown by confocal imaging of P1A+P511 tumor sections from Rag1 −/−B10.D2 or Rag1 −/−GzmB-TomB10.D2 mice five days after D-7 transfer with or without 3 x 10⁶ TCRP1ACD8+T cells injected i.v. A magnification of the insert is shown in the rightmost panel. (G) Mean fluorescence intensity (MFI) measured as region−of−interest (ROI) values for NKp46 (blue bars) and GzmB-tdTom (GzmB−Tom, red bars) in NK cells from Rag1 −/−GzmB-TomB10.D2 mice, either with or without CD8+T cell transfer. *, p ≤ 0.05. (H) Expression of GzmB-Tom and its mean fluorescence intensity in the NK1.1+ population is shown in the tumor-draining LN and P1A+P511 tumors from Rag1 −/−B10.D2 or Rag1 −/−GzmB-TomB10.D2 mice with or without TCRP1ACD8+T cell transfer. Numbers in quadrants represent % positive cells and MFIs. (I) Bar graph showing mean fluorescence intensity (MFI) of the GzmB-tdTom in NK1.1+ NK cells isolated from the TDLN and tumor of Rag1 −/−GzmB-TomB10.D2 mice (n=3) either left untreated (No T; red bars) or receiving TCRP1ACD8+T cell adoptive transfer (TCRP1ACD8+T; blue bars). Data are representative of three independent experiments. Values on the bar graphs are represented by the mean ± SD, ***p<0.001.
Figure 5
Figure 5
Pseudopodial membrane tunneling nanotube-like structures mediate physical interactions between CD8+T and NK cells. (A) Diagram and electron micrograph of 3D silica nanofiber carpet made of ε-polycaprolactone nanofibers ranging from 200 nm in diameter at the base to 100 nm at the tip and 20 to 50 μm in length, similar in size to reticular fibers such as collagen III. The fibers were spaced every 2 μm and tethered to the base substrate, creating a gradient of stiffness through the thickness of nanofibers analogous to the basement membrane to detect an optimal condition to visualize the migration and support of lymphocytes. (B) Laser scanning confocal microscopy images of transitory membranous nanotubes (white arrows) formed by naïveNK (purple) or activated actCD8+T (red) cells during their interaction. The pseudopodial contact and transfer of membrane fragment are visible from actCD8+T to the membrane of naïveNK. (C) The cellular kinetics of membrane invagination, protrusion, and transfer marked by white arrows are shown in a time-lapse imaging from actCD8+T cell (red) into naïveNK (purple). (D) Membrane transfer (white arrows) is shown from naïveNK (purple) to naïveCD8+T cells (red) by time-lapse confocal imaging. The rightmost panel shows the transferred membrane on CD8+T cell. (E) Line plot showing median Speed-Distance Index (y−axis; units of Shannon index per cell) across successive time bins (x−axis; binned by hours post−interaction as indicated) for three distinct NK−NK, NK−T and T−T intercellular interaction modalities. Each colored line denotes the median SDI for one interaction type, with the shaded envelope representing the interquartile range. (F) Histogram displaying the frequency of measured distances (in pixels) between CD8+T cell and NK cell centroids across all analyzed fields (bin width = 10 pixels). The vertical red dashed line at 250 pixels denotes the predefined proximity threshold used to classify cell pairs as “close” (≤ 250 pixels) versus “distant” (> 250 pixels). (G) Bar graph representing average pixel counts of transferred membrane fragments (magenta) quantified in CD8+ T and NK cells. (H) Representative image showing the migration trajectory of a CD8+T cell interacting with NK cells across three behavioral phases: Ph1 (pre-contact), Ph2 (contact), and Ph3 (post-contact). The yellow line indicates the cell track; instantaneous velocities (μm/s) are annotated. The significant drop in T cell velocity during Ph2 illustrates interaction-induced deceleration. (I, J) Deceleration ratios (Ph2/Ph1) plotted for individual CD8+T cells (n = 20). Each red dot represents a single cell. The Y-axis shows the velocity deceleration ratio [Velocity during contact (Ph2)/Velocity before contact (Ph1)], while the X-axis indicates the cell index number (not a measurement). More than 70% of cells exhibit a deceleration ratio ≤ 0.2, indicating a ≥ 5-fold motility reduction during NK cell contact. (K) Membrane CD25 and CD69 expression on actCD8+T and naïveNK cells. The upper panel shows CD25 and CD69 expression zebra dot plots on gated unlabeled naïveNK cells after the co-culture with naïveCD8+T (left plot) or with activated actCD8+T labeled with fluorochrome-conjugated antibodies to CD25 and CD69 for 20 min (middle) and 24 h (right). Lower panels show corresponding histograms and bar graphs for the transferred CD25 and CD69 expression detected on the membrane of unlabeled naïveNK cells with or without interaction with actCD8+T. Data are representative of at least three independent experiments. Values are mean ± SD, *p = 0.03.
Figure 6
Figure 6
Activated CD8+T cells and naïve NK cells engage in reciprocal crosstalk. (A) Expression of CD69, CD25, CD122, and CD132 molecules is shown from gated activated CD8+T cells cultured alone (actCD8+T) or together with naïve NK cells (actCD8+T + naïveNK) or from gated naïve NK cells cultured alone (naïveNK) or together with activated CD8+T cells (actCD8+T + naïveNK) for 24 h (B) Quantitative flow cytometric assessment of surface activation markers (CD69, CD25, CD122, CD132) and viability (7AAD) on gated activated CD8+ T cells (actCD8+T, green), naïve NK cells (naïveNK, red), and cells from co-culture (actCD8+T + NK, blue). Data is shown as mean ± SEM. Values mean ± SD. #, p = 0.08; *, p ≤ 0.05; ***, p ≤ 0.001. (C) Bound intracellular IL-2-Fc staining in gated actCD8+T or NK cells cultured alone (red) or together (blue) for 24 h (D) Fold−change analysis of intracellular IL−2, IFN−γ, IL−4, the IFN−γ/IL−4 ratio, and IL−15Rα chain measured in activated CD8+T cells (green bars) and NK cells (red bars) following 24 h co-culture versus monoculture. Data are expressed as mean ± SEM from three independent flow experiments. *, p ≤ 0.05. (E) Expression analysis of CD107a by NK cells cultured alone or with actCD8+T cells for 36 h (F) The heatmap graph shows fold changes in the proportion of phospho-forms of indicated signaling proteins (pX) normalized to their total content (X) in CD8+T cells or NK cells co-cultured with naïveNK or actCD8+T cells. The ratio [pX, Co-culture: total X, Co-culture] was normalized to the ratio [pX, Monoculture: total X, Monoculture] obtained for individual (CD8+T or NK) cell cultures as per the formula [pX, Co-culture: total X, Co-culture]/[pX, Monoculture: total X, Monoculture]. *, p ≤ 0.05; **, p ≤ 0.01. (G) Bar graphs of CD44 versus CD62L on gated central (CD44+CD62L+) and effector (CD44+CD62L) memory CD8+T cells in co-culture compared with monoculture. *, p ≤ 0.05. (H) Heatmap graph showing the dynamics of surface expression changes of IL-7R and IL-15R in the central (CD44+CD62L+) and effector (CD44+CD62L) actCD8+T cells co-cultured with naïveNK cell or alone using an in vitro D–7 protocol. ***, p ≤ 0.001. (I) Heatmap graph showing the dynamics of changes in IL-7R and IL-15R expression in naïveNK (CD49b+CD11b+) co-cultured with actCD8+T cells or alone. Numbers depict % positive cells. Data are representative of at least three independent experiments. Values are mean ± SD, *, p ≤ 0.05; ***, p ≤ 0.001.
Figure 7
Figure 7
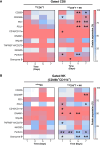
Time-dependent upregulation of key protein network molecules through CD8+T–NK cell interactions. Heatmaps showing relative changes of protein expression in CD8+ T cells (A) and NK cells (B) under monoculture (left) and co-culture (right) (in vitro D–7 protocol) conditions at indicated time points. Asterisks denote statistically significant differences compared to monoculture controls; *, p ≤ 0.05; **, p ≤ 0.001.
Figure 8
Figure 8
Three-phase model of preemptive immunosurveillance against tumors. Early crosstalk between CD8+ T cells and NK cells orchestrates three sequential phases—homeostatic pre-priming, effector, and post-effector memory—that mount an appropriate response against emerging tumor antigen–escape variants. In the homeostatic pre-priming phase, early reciprocal interactions, established by pre-tumor adoptive T cell transfer, provide tonic conditioning, trigger activation signals, and induce IFN-γ–dependent chemokines, driving spontaneous NK cell activation and recruitment to tumors and tumor-draining lymph nodes. During the effector phase, following direct antigen presentation and/or cross-presentation by APCs, sustained CD8+T–NK ligand–receptor engagement elicits robust CD8+T cell cytotoxicity and differentiation toward central memory (TCM) precursors, in concert with NK effector activity (e.g., CD107a, granzyme B degranulation). In the post-effector memory phase, the pre-tumor adoptive T cell transfer exhibits reduced TCM persistence as antigen–escape tumor variants are efficiently cleared. By contrast, post-tumor T cell transfer faces ongoing antigenic evolution under antigen-specific T cell pressure, sustaining TCM persistence. Moreover, regulatory mechanisms mediated partly by NK cells balance cytotoxic activity, effector persistence, and T cell memory formation. Thus, CD8+ T–NK crosstalk is essential for preemptive immunosurveillance, restraining tumor antigen escape. Analyses of human datasets (blue boxes) corroborate ligand–receptor pairs involved in CD8+ T–NK physical interactions, underscoring their clinical relevance.

References

    1. Wang Q, Shao X, Zhang Y, Zhu M, Wang FXC, Mu J, et al. Role of tumor microenvironment in cancer progression and therapeutic strategy. Cancer Med. (2023) 12:11149–65. doi: 10.1002/cam4.5698, PMID: - DOI - PMC - PubMed
    1. Park K, Veena MS, Shin DS. Key players of the immunosuppressive tumor microenvironment and emerging therapeutic strategies. Front Cell Dev Biol. (2022) 10:830208. doi: 10.3389/fcell.2022.830208, PMID: - DOI - PMC - PubMed
    1. Ribas A, Wolchok JD. Cancer immunotherapy using checkpoint blockade. Science. (2018) 359:1350–5. doi: 10.1126/science.aar4060, PMID: - DOI - PMC - PubMed
    1. Linette GP, Stadtmauer EA, Maus MV, Rapoport AP, Levine BL, Emery L, et al. Cardiovascular toxicity and titin cross-reactivity of affinity-enhanced T cells in myeloma and melanoma. Blood. (2013) 122:863–71. doi: 10.1182/blood-2013-03-490565, PMID: - DOI - PMC - PubMed
    1. Liu Y, Yan X, Zhang F, Zhang X, Tang F, Han Z, et al. TCR-T immunotherapy: The challenges and solutions. Front Oncol. (2022) 11:794183. doi: 10.3389/fonc.2021.794183, PMID: - DOI - PMC - PubMed

MeSH terms

Substances