. 2025 Oct 10;11(41):eadx9917.
doi: 10.1126/sciadv.adx9917. Epub 2025 Oct 8.

Ligand-receptor interactions induce and mediate regulatory functions of BATF3+ B cells

Affiliations

Ligand-receptor interactions induce and mediate regulatory functions of BATF3+ B cells

Hui Yan et al. Sci Adv. .

Abstract

B cells express many protein ligands, yet their regulatory functions are incompletely understood. We profiled ligand expression across murine B sublineage cells, including those activated by defined receptor signals, and assessed their regulatory capacities and specificities through in silico analysis of ligand-receptor interactions. Consequently, we identified a B cell subset that expressed cytokine interleukin-27 (IL-27) and chemokine CXCL10. Through the IL-27-IL-27 receptor interaction, these IL-27/CXCL10-producing B cells targeted CD40-activated B cells in vitro and, upon induction by immunization and viral infection, optimized antibody responses and antiviral immunity in vivo. Also present in breast cancer tumors and retained there through CXCL10-CXCR3 interaction-mediated self-targeting, these cells promoted B cell PD-L1 expression and immune evasion. Mechanistically, Il27 and Cxcl10 transcription was induced by synergizing Toll-like receptor (TLR) and CD40 signals and driven by coinduced transcription factor BATF3, which directly targeted these genes. By applying a discovery framework focusing on regulatory cells, our findings expand the recognized scope of B cell regulatory functions.


Figures
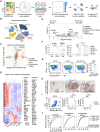
Fig. 1.
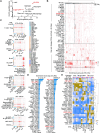
Fig. 1.. Workflow, profiling, and induction of IL-27 and CXCL10 in B cells.
(A) A discovery workflow involving (1) integration of custom bulk RNA-seq datasets and public datasets (ImmGen), (2) ligand selection based on specificity scores and enrichment score analysis of CCC-LRIs, (3,4) experimental validation of selected CCC-LRIs in different pathophysiological contexts, and (5) identification and function characterization of hallmark TFs. (B) Function groups of communication factors. (C) Induction of transcript levels and chromatin accessibility in inducible, constitutively active, and constitutively inactive ligand/receptor genes in B.LPS, B.CD154, B.LC, and B.LC21 cells after stimulation for 24 hours compared to B.Nil cells. (D) Nonsupervised clustering of DEGs that encoded ligands/receptors in B.Nil, B.LPS, B.CD154, and B.LC cells (left) and DEGs in B.LC cells (right). (E) Volcano plot of DEGs in B.LC and B.LC21 combined (left) as compared to B.LPS and B.CD154 combined (right). (F) Enzyme-linked immunosorbent assay (ELISA) of IL-27 (left) and CXCL10 (right) secreted by purified spleen B cells or bone marrow–derived macrophages (BMDM) after stimulation. (G) Fluorescence-activated cell sorting (FACS) analysis of GFP+ Tg(Il27p28-Gfp) B cells after stimulation with CD154 plus IL-21 (B.C21), costimulation of LPS plus CD154 and IL-21 (B.LC21), or stimulation with LPS for 6 hours, washing to remove LPS, and then C21 (B.LPS-C21). (H) RNAscope analysis of Il27p28 transcripts (red signals) within B cells, as stained for CD19 (brown), in parabronchial areas in C57 mice 7 days after VVWR infection. Representative of three different mice. (I) FACS analysis of IL-27p28 and GFP expression in B cells from the mediastinal lymph node (mLN) and spleen of VVWR-infected Tg(Il27p28-Gfp) mice. (J) Expression distribution of ligand/receptor genes in different B cell subsets sorted from the spleen of VVWR-infected Tg(Il27p28-Gfp) mice. *P < 0.05; **P < 0.01; ***P < 0.001; ****P < 0.0001, unpaired two-tailed t test in (F), (G), and (I). d, day; n.s., not significant. ECDF, empirical cumulative distribution function. PE, phycoerythrin.
Fig. 2.
Fig. 2.. Prediction of immune regulation by CCC-LRI enrichment scores.
(A) Specificity scores of Il27p28 and Cxcl10 in all 46 immune cell types/subtypes. (B) Heatmap of enrichment scores of all 418 LRIs in the 2116 (46 CellL × 46 CellR) CCCs, with each of the 46 immune sublineage cells as CellL, as indicated, that engaged each of the 46 cells as CellR. CCCs involving adaptive immune cells (top), hematopoietic innate cells (middle), and nonhematopoietic innate cells (bottom) were separated by solid lines. The dashed rectangle included LRIs used by B cell subsets more frequently than other adaptive immune cells as CellL. The gray arrowheads indicated Il21 → Il21r and clustered Ctla4 → Cd28, Ctla4 → Cd80 and Ctla4 → Cd86 within the area in which LRIs were commonly used by adaptive immune cells as CellL. (C) Bubble plots of enrichment scores of selected LRIs, as indicated, in the 2116 CCCs, with dominant CellL indicated. (D) Rank-order bar graphs depicting LRIs with top 40 enrichment scores in CCCs involving IL-27+CXCL10+ B cells, which included B.IgDGFP+ cells in vivo (left) and B.LC/21 cells in vitro (right) as CellL and naïve CD8+ T cells as CellR. Il27 → Il27ra was a dominant LRI in these CCCs. (E) Clustering of CellR and associated heatmap based on enrichment scores of 36 LRIs, as indicated, that showed similar enrichment score patterns in CCCs involving B.IgDGFP+ cells or B.LC/21 cells B as CellL and different B cell subsets as CellR. The two CellR clusters were indicated by dashed rectangles. LRIs involving Vegfa were potentially interesting, as B cells were not known to produce vascular endothelial growth factors (VEGFs).
Fig. 3.
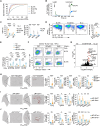
Fig. 3.. IL-27+ B cells target CD154-activated B cells in vitro and mediate antiviral immunity in vivo.
(A) Expression distribution of IgV(D)J gene transcripts in purified B cells after stimulation. (B) FACS analysis of Ca2+ flux in pregenerated B.LPS and B.LC cells in response to BCR-cross-linking anti-IgM. (C and D) FACS of (C, left) CSR to IgG1 and (D) plasma cell differentiation in the presence of IL-4, and (C, right) ELISA of different Ig isotypes secreted by stimulated B cells. (E) CSR to IgG2a in CD45.2+ B.CD154, B.C21, or B.LPS cells as target cells (CellR) in the presence of CD45.1+ B.LC21 as CellL and/or IFN-γ, as indicated, for 96 hours. When B.Nil cells were used as CellR, no B cell activation or CSR occurred. (F) Pregenerated CD45.2+ B.LA21 cells of different genotypes, as indicated, were used as CellL to coculture with preactivated CD45.1+ B.C21 and B.LPS cells as CellR for 72 hours before FACS analysis of CSR to IgG2a in CellR. Representative of three independent experiments. (G) Volcano plot of DEGs induced by IL-27 in B.CD154 cells. (H to J) RNAscope analysis of VVWR-specific transcripts (pink signals) in the lung from (H) mb1creIl27p28fl/fl, (I) μMT:Ebi3−/−, and (J) μMT:Il27ra−/− mice and their respective “wild-type” control mice 10 days after VVWR infection and quantification of the transcripts (four areas in three different mice in each group), ELISA of virus-specific IgG2a, IgG1, or IgG in the circulation, FACS analysis of IgG2a+ and IgG1+ B cells and plasma cells, and/or VVWR titers in different organs. *P < 0.05; **P < 0.01; ***P < 0.001; ****P < 0.0001, one-way analysis of variance (ANOVA) multiple comparisons Tukey test in (E) and unpaired two-tailed t test in (C), (D), and (H) to (J). TPM, tags per million. PFU, plaque forming unit.
Fig. 4.
Fig. 4.. IL-27+ B cells optimize antibody responses in vivo.
(A) Flow imaging analysis of B220, IL-27p28, and GFP (indicating Il10 transcription) expression in B cells (left) and FACS analysis of proportions of IL-27p28+ and GFP+ B cells (right) in Il10IRES-Gfp mice immunized with NP-CGG/alum/LPS for 14 days. Also depicted were “secretory vesicle-like structures” on the plasma membrane in bright field. (B) Quantitative reverse transcription polymerase chain reaction (qRT-PCR) analysis of transcript levels of cytokine genes (top; data were normalized to Gapdh expression) and ELISA of IL-27 (bottom) in the spleen of C57 and μMT mice 7 days after NP-CGG/alum/LPS immunization. (C) ELISA of IL-27 in the spleen from mb1creIl27p28fl/fland “wild-type” mb1creIl27p28+/fl littermates 14 days after NP-CGG/alum/LPS immunization (first panel), qRT-PCR analysis of cytokine gene transcript levels of (second panel), and CSR-related gene expression (third panel), as indicated, as well as FACS analysis of GL-7+, IgG2a+, and plasma cells (fourth to sixth panels) and ELISA of NP32-binding IgG2a (last panel). (D) ELISA of IL-27 in the spleen in μMT:Ebi3−/− mice and their μMT:Ebi3+/+ counterparts immunized with NP-CGG/alum/LPS for 14 days (first panel) and in the circulation at different time points (second panel), FACS analysis of IgG2a+ and GL-7+ B cells as well as plasma cells in the spleen (third to fifth panels), and ELISA of total (NP32-binding) specific IgG2a and high-affinity (NP4-binding) IgG1 and IgG2b (sixth to eighth panels) in these mice 14 days after immunization. (E) ELISA of NP-specific IgG and FACS analysis of B and T cell differentiation in the spleen in single and double KO mixed bone chimera mice, as indicated, 14 days after NP-CGG/LPS/alum immunization. *P < 0.05; **P < 0.01; ***P < 0.001; ****P < 0.0001, unpaired two-tailed t test in (B) to (D) and one-way ANOVA multiple comparisons Tukey test in (E).
Fig. 5.
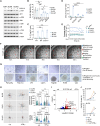
Fig. 5.. Self-targeting of IL-27+CXCL10+ B cells to form clusters.
(A) Immunoblotting of AKT, ERK, p38, protein kinase A (PKA), and their respective phosphorylated form (indicating activation) in B cells, as indicated, in the absence of presence of recombinant CXCL10 (20 nM). Representative of two independent experiments. (B) Modified transwell analysis of migration of C57 [wild-type (WT)] after preactivation for 72 hours, as indicated, and preactivated Cxcl10−/− and Il27ra−/− B.LA21 cells from the top chamber to the bottom chamber containing LPS as the chemoattractant. Wild-type (WT) B.LA21 cells were also analyzed in the presence of AMG487. Depicted was the percentage of cells showing migration. (C) ELISA of IL-27 secreted by WT or Cxcl10−/− B cells after stimulation in the absence of presence of recombinant CXCL10 (20 nM) for 72 hours. (D) ELISA of CXCL10 secreted by WT, Il27p28−/−, and Il27ra−/− B cells after stimulation for 48 hours. (E) Average size of B cell clusters formed between 72 and 82 hours after stimulation. The size increased when clusters merged but decreased due to postmerge rounding. Newly emerged smaller clusters were excluded. (F) Formation of B cell clusters upon stimulation from 72 to 80 hours. Representative of three independent experiments. (G) B cell cluster formation upon 48 hours stimulation by a TLR ligand alone or with αCD40/IL-21 added at 24 hours. (H) Normalized movement tracks of 20 random B cell clusters, as in (E) and (F), over 5 hours and the distance traveled by 50 clusters and their velocities. (I) DEGs induced by IFN-γ in B.CD154 cells. (J) FACS analysis of proportions of CXCR3+ B.CD154 and B.LPS cells stimulated in the presence of IL-27 and/or IFN-γ. *P < 0.05; **P < 0.01; ***P < 0.001; ****P < 0.0001, unpaired two-tailed t test in (B) and (D) and two-way ANOVA multiple comparisons in (H) and (J). h, hours.
Fig. 6.
Fig. 6.. IL-27–dependent PD-L1 expression and CXCR3-dependent retention of TAL-Bs in BCa.
(A) FACS analysis of protein expression in CD45+ cells in E0771 tumors and inLN in C57 mice (n = 5). (B) GFP and CXCL10 expression in IgD and IgD+ B cells in E0771 tumors in Tg(Il27p28-Gfp) mice. (C) E0771 tumor growth in mixed bone marrow chimera mice, as indicated. (D) Proportions of IL-27p28+ and PD-L1+ TILs and CD4+ and CD8+ T cells in E0771 tumors and inLN in μMT:Il27p28−/− mice and wild-type counterparts. (E) E0771 tumor growth in AicdacreCd274fl/fl mice, their wild-type littermate, and μMT mice (left) and proportions of different immune cells/subsets (right). (F) Tumor growth in AicdacreCd274fl/fl and AicdacreCd274+/+ littermates after E0771 tumors reaching ~400 mm3 (median of 10 days in AicdacreCd274+/+ mice and 25 days in AicdacreCd274fl/fl mice after engraftment) were treated with αPD-L1 or isotype control. (G) Tumor growth from E0771 (5 × 105) or D2A1 (106) cells in mice, as indicated. (H) Proportions of IL-27p28+ B cells in E0771 or D2A1 tumors, inLN, and spleen in mice treated with AMG487 (AMG) or vehicle (Veh). (I) E0771 tumors (~100 mm3) were treated and monitored for growth (left) and proportions of PD-L1hi B cells (right). (J) D2A1 tumors (~100 mm3) were treated and monitored for growth (left) and proportions of CD8+ T cells in tumors, inLN, and spleen. (K) E0771 tumor growth in mixed bone marrow chimera mice, as indicated. (L) Proportions of CXCR3+ cells within IL-27p28+ TAL-Bs in D2A1 tumors and within B cells in the inLN and spleen. (M) A model of IL-27+CXCL10+ TAL-B retention in murine BCa tumors through the CXCL10-CXCR3 LRI. *P < 0.05; **P < 0.01; ***P < 0.001; ****P < 0.0001, unpaired two-tailed t test in (B), (D), and (E), mixed lineage effect model test in (E) to (G) and (I) to (K), and two-way ANOVA multiple comparisons in (H) to (J) and (L).
Fig. 7.
Fig. 7.. BATF3 as an important TF in IL-27+CXCL10+ B cells.
(A) Taiji-calculated TF PageRanks in different B cells and the ranking of selected TFs. (B) RNA-seq analysis (n = 4) of transcripts encoding the AP-1 family of TFs or those that bind AP-1 sites in different B cells, as in (A). (C) Comparison of Taiji-computed PageRank and expression of TFs in B.LC21 cells and those in B.Nil, B.LPS, or B.CD154 cells. (D) De novo motif enrichment analysis of AP-1-binding TRE motif and κB motif in DARs that displayed high ATAC-seq reads in B.LC/21 cells, but not in B.LPS or B.CD154 cells (top), as well as enrichment analysis of TRE and κB motifs in BATF3-bound DNA in wild-type, but not Batf3−/− B.LA21 cells (bottom; NPAS4 site contained an embedded TRE motif). (E) Taiji-computed weight score of putative target genes of BATF3 in different B cells. (F) Kinetics of induction of Il27p28 and Batf3 in B.LC21 cells. Representative of two independent experiments. (G) DEGs and functional annotation of selected genes, as indicated, in Batf3+/+ and Batf3−/– B.LA21 cells. (H) Gene set enrichment analysis (GSEA) of the enrichment of the 125 BATF3-up-regulated genes in B.LC cells compared to B.LPS and B.CD154 cells as well as in B.LC21 cells compared to B.LPS and B.C21 cells. (I) Gene ontology analysis of all DEGs in Batf3+/+ wild-type B.LA21 cells and their Batf3−/− B cell counterparts, as in (G). (J) FACS analysis of IL27p28+ leukocytes and B cells in the spleen and ELISA of IL-27 per spleen in μMT:Batf3−/− mice and their wild-type counterparts immunized with NP-CGG/LPS/alum for 12 days. *P < 0.01; **P < 0.01; ***P < 0.001; ****P < 0.0001, two-way ANOVA multiple comparisons in (E) and unpaired two-tailed t test in (J). FDR, false discovery rate.
Fig. 8.
Fig. 8.. BATF3 function modality in B cells.
(A) Tracks depicting BATF3-binding, accessibility, and transcription in the Il27p28, Cxcl10, and Batf3 loci in Batf3+/+ and Batf3−/− B.LA21 cells and/or control B.LPS and B.A21 cells. Each track was representative of two to four independent experiments. (B) Radar plots depicting the integration of four datasets, as indicated. (C) Ranking score of genes directly targeted by BATF3 (left) as calculated by integrating four datasets detailed in (B), with the positive values (140/348 genes) indicating enhanced transcription and negative values (208/348 genes) indicating suppressed transcription. Genes indirectly regulated (i.e., no BATF3-binding) were also depicted (right). (D) Known motif enrichment analysis of κB motif (RELA- and REL-binding) and AP-1–binding TRE motif (FOSL2- and FRA-binding) in differentially RELA-bound DNA in B.LA21 cells (chromatin immunoprecipitation sequencing, after normalization using input DNA). (E) Super enhancers (SEs) and typical enhancers (TEs) bound by BATF3 or RELA in B.LA21 and B.LPS cells. (F and G) Histone modifications, TF binding, and Taiji-computed TF affinities around (F) the Il27p28 TSS (chromosome 7, nucleotide 126,595,035), including the 30-bp “Region 1,” and (G) the Cxcl10 TSS (chromosome 5, nucleotide 92,348,900) in B.LA21 and B.LPS cells. (H) Taiji-calculated weight score of different TFs in the Il27p28 and Cxcl10 loci in Batf3+/+ and Batf3−/− B.LA21 cells (TFs showing no difference were not depicted). (I) Target genes showing different weight scores for each TF, as indicated, in Batf3+/+ and Batf3−/− B.LA21 cells and their weight scores. The numbers of such genes were indicated in the parentheses. (J) Venn diagram depicting the relationship of 140 genes that were directly targeted by BATF3 for transcription activation (blue), 5000 genes in which the activities of RELA were boosted by BATF3 (yellow) and 3112 genes in which the activities of IRF8 were boosted by BATF3 (green). nt, nucleotide.

References

    1. Xu Z., Zan H., Pone E. J., Mai T., Casali P., Immunoglobulin class-switch DNA recombination: Induction, targeting and beyond. Nat. Rev. Immunol. 12, 517–531 (2012). - PMC - PubMed
    1. Victora G. D., Nussenzweig M. C., Germinal centers. Annu. Rev. Immunol. 40, 413–442 (2022). - PubMed
    1. Rivera C. E., Zhou Y., Chupp D. P., Yan H., Fisher A. D., Simon R., Zan H., Xu Z., Casali P., Intrinsic B cell TLR-BCR linked coengagement induces class-switched, hypermutated, neutralizing antibody responses in absence of T cells. Sci. Adv. 9, eade8928 (2023). - PMC - PubMed
    1. Shen P., Fillatreau S., Antibody-independent functions of B cells: A focus on cytokines. Nat. Rev. Immunol. 15, 441–451 (2015). - PubMed
    1. Rosser E. C., Mauri C., The emerging field of regulatory B cell immunometabolism. Cell Metab. 33, 1088–1097 (2021). - PubMed

MeSH terms

LinkOut - more resources