. 2025 Oct 8;13(10):e012934.
doi: 10.1136/jitc-2025-012934.

Neural stem cell-delivered oncolytic virus via intracerebroventricular administration enhances glioblastoma therapy and immune modulation

Affiliations

Neural stem cell-delivered oncolytic virus via intracerebroventricular administration enhances glioblastoma therapy and immune modulation

Huihui Chai et al. J Immunother Cancer. .

Abstract

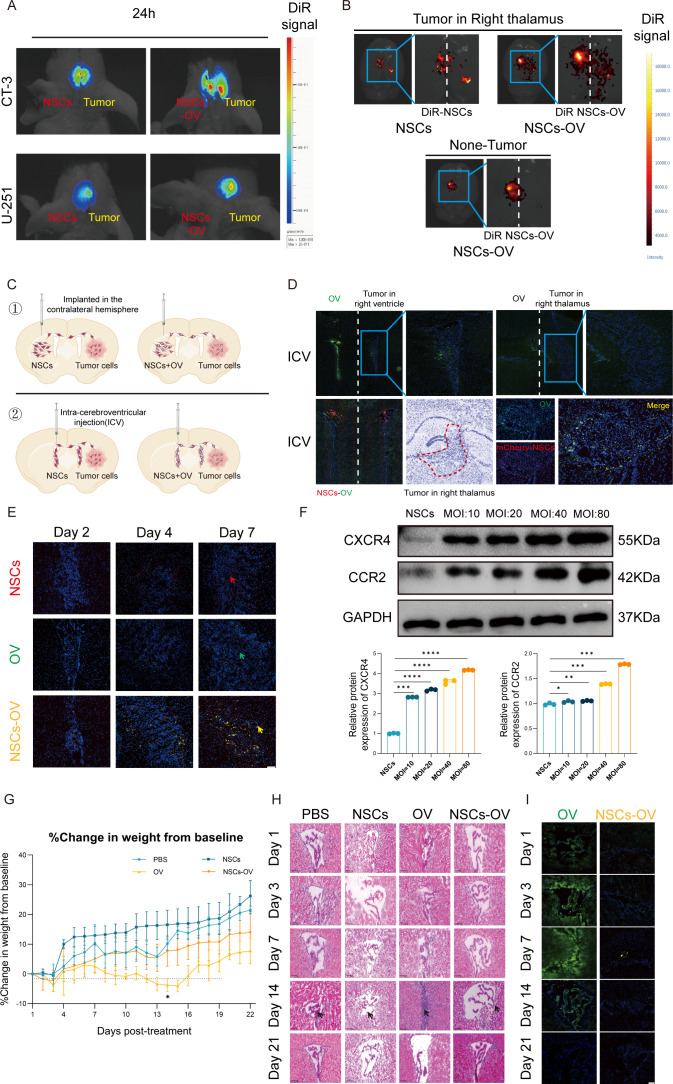
Background: Glioblastoma (GBM) is a highly aggressive brain tumor with poor prognosis and limited treatment options. Oncolytic virus (OV) therapy holds promise but is hindered by immune neutralization and poor tumor infiltration. Neural stem cells (NSCs) can enhance OV delivery, and intracerebroventricular (ICV) administration offers broader tumor access. This study evaluates NSC-OV therapy via ICV injection for improved tumor targeting and immune modulation in GBM.

Methods: NSCs were infected with OV and assessed for viral uptake and replication. In vitro assays examined NSC-OV effects on glioma proliferation and migration. In vivo xenograft and orthotopic models evaluated tumor targeting, therapeutic efficacy, and immune modulation. Humanized immune system mouse models enabled single-cell RNA sequencing and flow cytometry analysis of immune responses.

Results: NSCs retained their stemness after OV infection. NSCs-OV significantly inhibited glioma cell migration, proliferation, and colony formation in vitro. In orthotopic GBM models, NSCs-OV exhibited enhanced tumor homing, prolonged viral persistence, and reduced tumor burden while minimizing inflammation and systemic toxicity. NSCs protected OV from neutralizing antibodies, leading to sustained efficacy. Single-cell RNA sequencing indicated that NSCs-OV therapy reduced tumor-promoting inflammation by downregulating S100A8/A9, markers of myeloid-derived suppressor cells (MDSCs) and chemotactic factors that recruited MDSCs into tumors. Combining NSCs-OV with Paquinimod further suppressed tumor growth by reducing MDSCs and increasing activated T cells.

Conclusions: NSCs serve as efficient OV carriers, enhancing tumor targeting, suppressing GBM progression, and modulating the immune landscape. The combination with Paquinimod amplifies therapeutic benefits, offering a promising strategy for improving GBM treatment outcomes.

Keywords: Central Nervous System Cancer; Myeloid-derived suppressor cell - MDSC; Oncolytic virus; Stem cell; Tumor microenvironment - TME.


Conflict of interest statement

Competing interests: KZ held ownership interests and owned patents for YSCH-01 at Yuansong Biotechnology. The other authors have no potential conflicts of interest to disclose.

Figures

Figure 1
Figure 1. Characterization and infection efficiency of NSCs with OV. Immunofluorescence staining of NSCs showing expression of stem cell markers CD133, Sox-2, and Nestin. (B) Immunofluorescence staining of NSCs showing expression of virus entry receptors CAR, CD46, and Integrin αVβ3. (C) Schematic representation of the experimental workflow for infecting NSC with OV, followed by immunofluorescence staining and flow cytometry analysis. (D) Fluorescence images of NSCs infected with adenovirus expressing EGFP at MOI (multiplicity of infection) of 1 and 80, demonstrating infection efficiency. (E) Flow cytometry analysis of EGFP+ cells after infection at MOI: 1 and MOI: 80. (F) Quantification of GFP+cells at increasing MOI values. (G) Transmission electron microscopy (TEM) images of infected NSCs. Right panel: magnified view of the boxed region. (H) Western blot and quantification analyses of stem cell markers (Nestin, CD133, Sox-2) in infected NSCs at different MOIs (0, 10, 20, 40, 80), with GAPDH as a loading control. (I) Western blot and quantification analyses of virus entry receptors (CD46, CAR) in infected NSCs at different MOIs (0, 10, 20, 40, 80), with GAPDH as a loading control. NSCs, neural stem cells; OV, oncolytic virus.
Figure 2
Figure 2. OV infection efficiency and cytotoxic effects in NSCs and glioma cells. Dose-response curves showing the cytotoxic effects of OV (YSCH-01) infection on NSCs, primary tumor cells (CT-3), glioma cell lines (U251 and GL261), human cortical neuron cells, and SVGp12 normal human astroglial cell lines. (B) TEM images of the infected CT3, U251, and GL261 cells. (C) Flow cytometry analysis of infected neural stem cells at different MOI (0, 1, 10, 20, 40, and 80). (D) Quantification of 7-AAD-positive NSCs at various MOI. (E) Real-time impedance-based measurement of NSCs viability following OV infection at different MOI. (F) Normalized impedance measurements at 48 hours postinfection. (G) Time-course analysis of NSCs viability at MOI of 40. (H) Quantification of viral replication over 4 days postinfection. *p<0.05, **p<0.01, ***p<0.001, ****p<0.0001. MOI, multiplicity of infection; NSCs, neural stem cells; OV, oncolytic virus; TEM, transmission electron microscopy.
Figure 3
Figure 3. Tumor-targeting ability of NSCs-OV in glioma models and NSCs mitigate OV-induced inflammatory responses. In vivo tracking of DiR-labeled NSCs and NSCs-OV in CT-3 and U-251 glioma-bearing mice. (B) Fluorescence imaging of DiR-labeled NSCs and NSCs-OV in a tumor localized to the right thalamus. (C) Schematic representation of the experimental models used to evaluate NSCs-OV targeting and efficacy. (D) Immunofluorescence imaging of tumor sections from ICV-injected mice. (E) Time-course analysis of NSCs (red arrow), OV (green arrow), and NSCs-OV (yellow arrow) localization within the glioma tissue. (F) Western blot analysis of CXCR4 and CCR2 expression in NSCs treated with increasing OV doses of OV (MOI: 10–80). (G) Body weight changes in mice treated with Phosphate Buffered Saline, NSCs, OV, or NSCs-OV. (H) H&E staining of brain ventricular sections at different time points post-treatment showing immune infiltrates (black arrow) in the ventricles. (I) Immunofluorescence imaging of tumor sections from OV-treated and NSCs-OV-treated mice at different time points. *p<0.05, **p<0.01, ***p<0.001, ****p<0.0001. ICV, intracerebroventricular; MOI, multiplicity of infection; NSCs, neural stem cells; OV, oncolytic virus.
Figure 4
Figure 4. Therapeutic effects of NSCs-OV in glioma-bearing mice with or without pre-existing neutralizing antibodies (NAb+or NAb⁻). Schematic of experimental design. C57BL/6 mice either received an intramuscular injection of Ad5 to induce NAb+ or were left untreated (NAb⁻). GL-261 glioma cells were implanted into the brain, followed by treatment with PBS, NSCs, OV, or NSCs-OV. (B–C) Quantification of NAb titers in Ad5-induced (B) and OV-treated (C) mice, showing significantly lower titers in NSCs-OV-treated mice than in direct OV injection. (D) Bioluminescence imaging of tumor growth in NAb⁻ mice and (F) NAb+mice treated with Phosphate Buffered Saline, NSCs, OV, or NSCs-OV. Quantification of tumor bioluminescence in NAb⁻ (E) and NAb + (G) mice. (H) H&E staining of brain tumor sections from NAb⁻ and NAb+ mice at the day 28. (I) Kaplan-Meier survival curves for NAb⁻ and NAb+mice. (J) Immunohistochemical staining for adenoviral E1A protein in tumor sections from NAb⁻and NAb+mice. (K) Quantification of E1A-positive cells in each field. A total of three mice were included in each experimental group. For each mouse, three tissue sections were prepared, and three randomly selected fields of view were analyzed per section. *p<0.05, **p<0.01, ***p<0.001. NSCs, neural stem cells; OV, oncolytic virus.
Figure 5
Figure 5. Single-cell sequencing and protein expression analysis of NSCs-OV in glioma models. UMAP clustering of single-cell RNA sequencing data identified major immune cell clusters, including myeloid, plasma, T-NK, B, and mast cells. (B) Comparative analysis of myeloid cell subclusters between the control and NSCs-OV treatment groups. NSC-OV therapy significantly altered the myeloid cell composition. (C) Proportional distribution of myeloid cell subclusters in NSC-OV-treated and control tumors. NSCs-OV therapy significantly altered the myeloid cell composition. (D) Hierarchical clustering of differentially expressed genes (DEGs) across myeloid cell subclusters using the MDSCs gene signature. The NSC-OV treatment group displayed a marked reduction in MDSC-associated gene expression. (E) Volcano plot displaying DEGs between the control and NSC-OV treatment groups. S100A8 and S100A9 levels were significantly downregulated following NSCs-OV therapy. (F) GO enrichment analysis of DEGs in NSCs-OV-treated tumors compared with the control, revealing significant changes in immune-related pathways in response to NSCs-OV treatment. NSC-OV therapy upregulated pathways related to immune activation and downregulated pathways associated with immune suppression. (G, H) qRT-PCR and western blot analyses of S100A8 and S100A9 protein expression in CT-3 glioma cells treated with Phosphate Buffered Saline, NSCs supernatants, or NSC-OV supernatants. Bar graphs in (H) represent densitometric quantification of the western blot bands. (I–J) Western blot analysis and quantification of S100A8 and S100A9 protein levels in orthotopic glioma implantation models of human CT-3 (I) and U-251-MG (J) tumors. (K) Multiplex immunohistochemical staining of glioma tumor sections for S100A8/A9 (red), CD15 (green), CD14 (white), and DAPI (blue) in control and NSCs-OV-treated groups. *p<0.05, **p<0.01, ***p<0.001. NSCs, neural stem cells; OV, oncolytic virus.
Figure 6
Figure 6. Combination therapy with NSCs-OV and paquinimod enhances antitumor efficacy in glioma models. Schematic representation of the experimental design. Glioma-bearing mice received different treatments, including PBS, paquinimod, NSCs, OV, NSCs-OV, or NSCs-OV combined with paquinimod. (B) H&E staining of brain tumor sections from the CT-3 and U-251 glioma models. (C, E) Bioluminescence imaging tracking tumor growth over time in CT-3 (C) and U-251 (E) glioma-bearing mice under different treatment conditions. (D, F) Quantification of tumor bioluminescence in the CT-3 (D) and U-251 (F) models. (G, H) Kaplan-Meier survival curves for CT-3 (G) and U-251 (H) glioma-bearing mice. NSCs, neural stem cells; OV, oncolytic virus.
Figure 7
Figure 7. NSCs-OV and paquinimod enhance T cell activation and reduce immunosuppressive populations in GL-261 murine orthotopic glioma model. Flow cytometric analysis of (A) total T cells, (B) CD4+ and CD8+ T cells, (C) PD1+CD8+ cells, (D) CD4+Foxp3+ cells, (E) M1 or M2 macrophages, and (F) myeloid-derived suppressor cells (MDSCs) across different treatment groups in GL-261 orthotopic implantation models. (G–J) Quantification of CD3+CD45+ T, CD4+ cells, CD8+ cells, PD1+CD8+ cells, and CD4+Foxp3+ cells from (B–D). (K, L) Quantification of CD86+ and CD206+ macrophages. (M, N) Quantification of Ly6G+ and Ly6C+ MDSCs. *p<0.05, **p<0.01, ***p<0.001. NSCs, neural stem cells; OV, oncolytic virus.

References

    1. Wu W, Klockow JL, Zhang M, et al. Glioblastoma multiforme (GBM): An overview of current therapies and mechanisms of resistance. Pharmacol Res. 2021;171:105780. doi: 10.1016/j.phrs.2021.105780. - DOI - PMC - PubMed
    1. White J, White MPJ, Wickremesekera A, et al. The tumour microenvironment, treatment resistance and recurrence in glioblastoma. J Transl Med. 2024;22:540. doi: 10.1186/s12967-024-05301-9. - DOI - PMC - PubMed
    1. Shi C, Zhang X, Zhao R, et al. Semantic structure preservation for accurate multi-modal glioma diagnosis. Sci Rep. 2025;15:7185. doi: 10.1038/s41598-025-88458-7. - DOI - PMC - PubMed
    1. Rahman MM, McFadden G. Oncolytic Viruses: Newest Frontier for Cancer Immunotherapy. Cancers (Basel) 2021;13:5452. doi: 10.3390/cancers13215452. - DOI - PMC - PubMed
    1. Marchini A, Daeffler L, Pozdeev VI, et al. Immune Conversion of Tumor Microenvironment by Oncolytic Viruses: The Protoparvovirus H-1PV Case Study. Front Immunol. 2019;10:1848. doi: 10.3389/fimmu.2019.01848. - DOI - PMC - PubMed

LinkOut - more resources