. 2025 Oct 8;16(1):8806.
doi: 10.1038/s41467-025-64042-5.

Elucidating molecularly stratified single agent, and combination, therapeutic strategies targeting MCL1 for lethal prostate cancer

Affiliations

Elucidating molecularly stratified single agent, and combination, therapeutic strategies targeting MCL1 for lethal prostate cancer

Juan M Jiménez-Vacas et al. Nat Commun. .

Abstract

Metastatic castration-resistant prostate cancer (mCRPC) is a lethal disease requiring additional therapeutic strategies. MCL1, an anti-apoptotic BCL2 family member, promotes cancer-cell survival, but its role in mCRPC remains poorly understood. Here, we characterise MCL1 in multiple mCRPC biopsy cohorts and patient-derived models, assessing responses to MCL1 inhibition. MCL1 copy number gain (14%-34%) correlates with increased MCL1 expression and worse outcomes. MCL1 inhibition exhibits anti-tumour effects in MCL1-gained mCRPC models. Co-inhibition of MCL1 and AKT induces cancer-specific cell death in PTEN-loss/PI3K-activated models in vitro and in vivo, modulating BAD-BCLXL and BIM-MCL1 interactions, with durable anti-tumour activity in models with AKT inhibitor acquired resistance. Finally, CDK9-mediated MCL1 downregulation combined with AKT inhibition recapitulates these findings, providing further opportunities for clinical translation. These data support early phase clinical trials targeting MCL1, both as monotherapy for MCL1-gained mCRPC, and in combination with AKT inhibition for PTEN-loss/PI3K-activated mCRPC.


Conflict of interest statement

Competing interests: J.M.J.-V., D.W., I.F., A.d.H.V., A.P., W.Y., G.S., D.B., B.G., C.B., S.M., L.B., W.Z., A.J.N., J.W., J.R., R.P., A.F., M.C., R.R., S.D., J.T., E.H., M.V., J.N., K.L., A.S., F.R., S.C., J.S.d.B. and A.Sharp are employees of the ICR, which has a commercial interest in abiraterone, PARP inhibition in DNA repair defective cancers, and PI3K/AKT pathway inhibitors (no personal income). A.G.S. reports that the National Cancer Institute (NCI) has a Cooperative Research and Development Agreement (CRADA) with Astellas. Resources are provided by this CRADA to the NCI. A.G.S. gets no personal funding from this CRADA but is the primary investigator of the CRADA. J.S.d.B. has served on advisory boards and received fees from many companies, including Amgen, Astra Zeneca, Bayer, Bioxcel Therapeutics, Daiichi, Genentech/Roche, GSK, Merck Serono, Merck Sharp & Dohme, Pfizer, and Sanofi Aventis. He is an employee of the ICR, which has received funding or other support for his research work from AZ, Astellas, Bayer, Cellcentric, Daiichi, Genentech, Genmab, GSK, Janssen, Merck Serono, MSD, Menarini/Silicon Biosystems, Orion, Sanofi Aventis, Sierra Oncology, Taiho, Pfizer, Vertex. J.S.d.B. was named as an inventor, with no financial interest, for patent 8,822,438, submitted by Janssen, that covers the use of abiraterone acetate with corticosteroids. J.S.d.B. has been the CI/PI of many industry-sponsored clinical trials. A.Sharp has received travel support from Sanofi, Roche-Genentech and Nurix, and speaker honoraria from Astellas Pharma and Merck Sharp & Dohme. He has served as an advisor to DE Shaw Research, CHARM Therapeutics, Ellipses Pharma and Droia Ventures. A.Sharp has been the CI/PI of industry-sponsored clinical trials. The remaining authors declare no conflicts of interest.

Figures
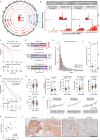
Fig. 1
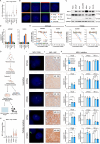
Fig. 1. MCL1 (1q21) copy number gain/amplification is common in CRPC, occurs early in tumour evolution, and associates with poor prognosis.
A, B Copy number alterations in TCGA (primary PC), SU2C/PCF (CRPC), and RMH (matched HSPC and CRPC) cohorts. A Chromosomes 1 (MCL1) and X (AR) are highlighted; B MCL1 locus (1q21) marked with an asterisk. CNA copy number alterations. Gain: copy number gain; Amp amplification. C Kaplan–Meier progression-free interval curves in TCGA cohort (n = 492) comparing patients with MCL1 gain/amplification vs those without. Hazard ratio (HR) with 95% confidence intervals and p-value from log-rank test shown. D Comparison of Gleason score, American Joint Committee on Cancer (AJCC) pathological tumour (T) and node (N) stages between patients with MCL1 gain/amplification vs those without in TCGA (n = 492). E, F Residual cancer burden in patients from the NCI neoadjuvant cohort (n = 37), treated with 6 months ADT and enzalutamide, stratified by MCL1 copy number (gain/amplification vs no gain/amplification). F Two-tailed Mann-Whitney U test; median indicated. INR Incomplete/non-responder, ER exceptional responder. G Kaplan–Meier overall survival for patients from FIRSTANA and PROSELICA trials (n = 152), stratified by MCL1 gain/amplification on baseline ctDNA. HR with 95% confidence intervals and p-values from log-rank test shown. H Baseline PSA and Hb in patients from FIRSTANA and PROSELICA trials (n = 152), stratified by MCL1 gain/amplification on baseline ctDNA; Two-sided Mann-Whitney U test used. Box shows the interquartile range (IQR), line indicates the median, and whiskers the min/max values. I MCL1 RNA expression by copy number status across TCGA (n = 491), SU2C/PCF (n = 106), RMH (n = 86), and UW/FH (n = 151) cohorts. Box (IQR), line (median), whiskers (min/max). Two-tailed Mann-Whitney U test. J MCL1 RNA expression in UW/FH cohort split by homogeneous (with and without MCL1 copy number gain/amplification) and heterogeneous copy number (n = 115 tumours from 50 patients with >1 tumour). Mean with min–max floating bars shown. NA Not available. K MCL1 IHC in 30 mCRPC biopsies from RMH cohort with RNA-seq data. Spearman correlation between MCL1 RNA and protein (OD) levels. L Representative IHC images from the 30-biopsy set. Scale bar = 100 µm. Source data are provided as a Source Data file.
Fig. 2
Fig. 2. Prostate cancer models with MCL1 copy number gain are sensitive to MCL1 inhibition.
A Violin plot of MCL1:Centromere (1p12) ratio in PNT2, LNCaP, C4-2, LNCaP95, 22Rv1, PC-3, and DU145 cell lines (n = 100 cells each). B Representative MCL1 FISH images (1 biological replicate; n = 100 cells). Scale bar = 10 µm. C MCL1, BCLXL, and BCL2 protein levels assessed by western blot in the same cell lines. GAPDH used as loading control. D Caspase 3/7 activity following AZD5991 (1 µM, left) or S63845 (1 µM, right) for 6 h using Caspase-Glo 2D. Mean ± Standard error (SEM) from three biological replicates, each with three technical replicates. Cell viability assessed by CellTiter-Glo 3D after 24 h (E) and 6 days (F) following treatment with six concentrations (1 µM highest, two-fold dilutions) of AZD5991 (left) or S63845 (right). Mean ± SEM from three biological replicates, each with three technical replicates is shown. Data depicted as fold change relative to vehicle (DMSO). G Workflow for mCRPC patient-derived xenograft (PDX) organoids (PDX-Os). Created in BioRender. Jimenez Vacas (2025) https://BioRender.com/7s2gcp5. H Violin plot of MCL1:Centromere (1p12) ratios in CP253c, CP336c, CP50c, CP267c (n = 100 cells each) and CP142c (n = 50). Median and IQR shown. One-way ANOVA with Tukeyʼs post-hoc test was performed. I Representative MCL1 FISH images of single PDX-O cells (1 biological replicate). Median MCL1:Centromere ratio shown. Scale bar = 5 µm. J Representative MCL1 IHC images from PDX tissues (single passage). Cytoplasmic H-score shown. Scale bar = 100 µm. K Caspase 3/7 activity (6 h) and organoid viability (24 and 96 h) in PDX-Os treated with AZD5991 or S63845 (1 µM), measured with Caspase-Glo 3D and CellTiter-Glo 3D. Mean ± SEM from three biological replicates, each with five technical replicates. Data shown as fold change relative to vehicle (DMSO). One-way ANOVA with Dunnett post-hoc test was performed. Source data are provided as a Source Data file.
Fig. 3
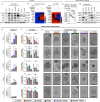
Fig. 3. PI3K/AKT pathway inhibition drives apoptosis when combined with MCL1 inhibition in LNCaP95 and C4-2 cell lines.
A FDA-approved drug screen (n = 166 drugs) in LNCaP95, C4-2, and PNT2 cells, in the presence and absence of AZD5991 (1 µM). FDA approved drugs used at 5 µM. Caspase 3/7 activity (6 h; Caspase-Glo 2D) and cell viability (24 h; CellTiter-Glo 2D) were assessed. The x-axis shows the effect of each FDA drug alone (FDA/DMSO), and the y-axis shows the added effect of combining AZD5991 with each drug (FDA + AZD5991/FDA). Experiment performed as a single biological replicate in technical singlets. PI3K inhibitors are highlighted in red. B Heatmaps showing the combined effect of AZD5991 with FDA drugs on caspase activation (6 h) and cell viability (24 h) in LNCaP95 and C4-2, normalised to the effect on the normal-like prostate cell line PNT2. Blue and red indicate increased or decreased caspase 3/7 activity or cell viability, respectively. C Zero Interaction Potency (ZIP) synergy scores comparing combinations of AZD5991 with PI3K inhibitors (copanlisib, buparlisib) versus AKT inhibitors (capivasertib, ipatasertib) in LNCaP95 cells. Data are mean ± SEM from three biological replicates (each with three technical replicates). One-way ANOVA with Tukey’s post-hoc test. D ZIP synergy surface plots for AZD5991 combined with PI3K (copanlisib, buparlisib; left) or AKT (capivasertib, ipatasertib; right) inhibitors in LNCaP95. Caspase 3/7 activity (6 h), cell viability (24 h), and protein expression of cleaved PARP, cleaved caspase 3, and phosphorylated AKT (Ser473) following treatment with DMSO, AZD5991 (1 µM), capivasertib (1 µM), ipatasertib (1 µM), or combinations in LNCaP95 (E) and C4-2 (F). Bars show mean ± SEM of three biological replicates (three technical replicates). Statistical comparisons performed using one-way ANOVA with Tukey’s post-hoc test. Asterisks indicate statistical significance between groups (***p < 0.001). Source data and exact p values are provided are provided as a Source Data file.
Fig. 4
Fig. 4. AKT and MCL1 co-inhibition triggers apoptosis through dysregulation of BAD, BIM and BAK interactions in LNCaP95 and C4-2 cell lines.
Impact of combined treatment 1 [CMB1; capivasertib (1 µM) and AZD5991 (1 µM)], and combined treatment 2 [CMB2; ipatasertib (1 µM) and AZD5991 (1 µM)] upon triple knockdown of BAK, BAD, and BIM (using specific OnTarget siRNAs at 25 nM for 72 h) or OnTarget Control siRNA (75 nM, 72 h) on caspase 3/7 (6 h; left panel), cell viability (24 h; middle panel) and protein expression (6 h; right panel) in LNCaP95 (A) and C4-2 (B). Caspase 3/7 activity, cell viability, and protein expression were measured by Caspase-Glo 3/7 2D, CellTiter-Glo 2D and western blot, respectively. GAPDH was used as a housekeeping. Data represent three biological replicates, each with three technical replicates. Bars indicate the mean ± SEM. Statistical significance was assessed using one-way ANOVA with Tukey’s post-hoc test. Asterisks indicate statistical significance between groups (**p  <  0.01; ***p  <  0.001). C Protein levels of BAK, phosphorylated BAD (Ser136), total BAD and BIM were measured by western blot in LNCaP95 and C4-2 cells treated with DMSO, AZD5991 (1 µM), capivasertib (1 µM), ipatasertib (1 µM), or their combinations. Experiment performed as a single biological replicate. D Immunoprecipitation of BCLXL (top), MCL1 (middle), and BIM (bottom) in LNCaP95 and C4-2 cells treated with DMSO, ipatasertib (1 µM), AZD5991 (1 µM), or the combination. BAD, BCLXL, BIM, BAK and MCL1 were blotted. Input and IgG pulldown controls included. Experiment performed as a single biological replicate. Source data and exact p values are provided as a Source Data file.
Fig. 5
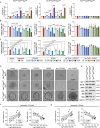
Fig. 5. AKT and MCL1 co-inhibition triggers apoptosis in prostate cancer patient-derived xenograft organoids harbouring PI3K/AKT pathway hyperactivating aberrations.
A The protein levels of phosphoBAD (Ser136; pBAD); total BAD, BIM, and BAK in PNT2, LNCaP, C4-2, LNCaP95, 22Rv1, PC3, and DU145 cell lines, with GAPDH as a loading control, were detected by western blot. This experiment was performed as a single biological replicate. B Heatmaps showing the effects of capivasertib (1 µM), ipatasertib (1 µM), AZD5991 (1 µM), S63845 (1 µM), and their combinations on caspase 3/7 activity (left panel, 6 h, measured by Caspase-Glo 3/7 assay) and cell viability (right panel, 24 h, measured by CellTiter-Glo 2D assay) in prostate-derived cell lines. Caspase 3/7 activity and cell viability are expressed as fold changes relative to vehicle (DMSO), with caspase data logarithmically transformed (log₁₀). C PI3K/AKT pathway activity was assessed by calculating the Reactome PI3K/AKT signalling pathway score from RNAseq data in CP50c, CP253c, CP267c, CP336c, and CP142c patient-derived xenograft (PDX) models. Data represent six biological replicates. The box shows the interquartile range, the line indicates the median, and the whiskers represent the minimum and maximum values. Statistical analysis was performed using one-way ANOVA with Tukey’s post-hoc test. D Protein levels of phosphoBAD (Ser136; pBAD), total BAD, BIM, and BAK were detected by western blot, with GAPDH as a loading control, in the PDX models. Caspase 3/7 activity at 6 h (E) and cell viability at 24 and 96 h (F) in response to vehicle (DMSO), ipatasertib (1 µM), AZD5991 (1 µM), S63845 (1 µM), and their combinations in CP50c, CP253c, CP267c, CP336c, and CP142c PDX-derived organoids (PDX-Os). Statistical analysis was performed using one-way ANOVA with Tukey’s post-hoc test. The vehicle, AZD5991, and S63845 arms (represented by dotted-pattern bars) were previously shown in Fig. 2K (same experiment). Asterisks indicate statistical significance between groups (*p < 0.05; **p < 0.01; ***p < 0.001). G Representative microscopy images of the PDX-Os on day 4 after treatment. The scale bar indicates a length of 50 µm. All the experiments were performed in three biological replicates and the standard error of the mean is shown. Source data and exact p values are provided as a Source Data file.
Fig. 6
Fig. 6. AKT and MCL1 co-inhibition triggers apoptosis in PTEN-deficient mouse prostate cancer organoids.
Prostate Cancer Preclinical Mouse Modelling Platform organoids (ProMPt-Os) were treated with vehicle (DMSO), ipatasertib (1 µM), AZD5991 (1, 5, and 10 µM), S63845 (1, 5, and 10 µM), and their combinations to assess caspase 3/7 activity at 6 h (A), cell viability at 24 h (B), and cell viability at 96 h (C). Caspase 3/7 activity and cell viability were assessed by Caspase-Glo 3/7 3D and CellTiter-Glo 3D, respectively. Data represent the mean ± SEM of three independent biological replicates, each performed with three technical replicates. Statistical analysis was performed using one-way ANOVA with Tukey’s post-hoc test. D Representative microscopy images of the ProMPt-Os on day 4 after treatment. This experiment was repeated three times with similar results. The scale bar indicates a length of 200 µm. E Protein levels of MCL1, BCLXL, pBAD (Ser136), BAD, BIM, and BAK were analysed by western blot with GAPDH as the loading control in ProMPt-Os. This experiment was performed as a single biological replicate. Spearman correlation between caspase 3/7 activity (left panels) or cell viability at 24 h (right panels) in response to ipatasertib + AZD5991 (F) or ipatasertib + S63845 (G) and basal pBAD (Ser136) levels in all cell lines, PDX-O, and ProMPt-O models. Simple linear regression is depicted, with the line representing the mean and the shaded area indicating the 95% CI. Caspase 3/7 activity is expressed as log10 fold change relative to vehicle, cell viability as fold change relative to vehicle, and pBAD levels as log10 of pBAD intensity normalised to GAPDH intensity. Spearman correlation coefficients and two-sided p-values are shown. Caspase 3/7 activity was measured using Caspase-Glo assays (2D for cell lines and 3D for PDX-Os/ProMPt-Os), and cell viability was measured using CellTiter-Glo assays (2D for cell lines and 3D for PDX-Os/ProMPt-Os). Source data are provided as a Source Data file.
Fig. 7
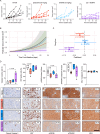
Fig. 7. The combination of ipatasertib and S63845 has anti-tumour activity in the CRPC PDX CP253c in vivo.
A Individual tumour volumes of CP253c treated with ipatasertib (50 mg/kg; n = 5), S63845 (25 mg/kg; n = 4), combined treatment (n = 5) and vehicle (n = 5). B Predicted tumour growth using a linear mixed-effect model of CP253c treated with ipatasertib (50 mg/kg; n = 5), S63845 (25 mg/kg; n = 4), combined treatment (n = 5) and vehicle (n = 5). C Forest plots showing the results from the longitudinal mixed effect model for log-transformed tumour volume. Estimates and p-values refer to the interaction term of treatment arm and time indicating the difference in tumour volume growth rate between each treatment arm and the vehicle arm. Points represent the random effect coefficients for each drug group and error bars the 95% confidence intervals. The black dotted line indicates the vehicle (reference level). D Comparison of protein expression for cleaved caspase 3 (% positive cells), Ki67 (% positive cells) and pGSK3B, pPRAS40 and MCL1 H-score for the different treatment arms. The box shows the interquartile range, the line indicates the mean, and the whiskers represent the minimum and maximum values. One-way ANOVA with post-hoc Fisher’s LSD test was performed. Representative IHC micrographs for end-of-treatment CP253c tumours are also shown (bottom panel). The scale bar indicates a length of 100 µm. Source data are provided as a Source Data file.
Fig. 8
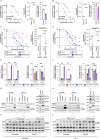
Fig. 8. CRPC cells with acquired resistance to capivasertib remain sensitive to AKT and MCL1 co-inhibition.
A, B Comparison of capivasertib dose-response curves (left panel), capivasertib IC50 (central panel) and basal cell growth (fold change to day 0; right panel) between Capi-R and parental LNCaP95 (A) and C4-2 (B) cells. A two-sided unpaired t-test assuming normal distribution was performed. Comparison of capivasertib dose-response curves (left panel) and capivasertib IC50 (right panel) in presence and absence of AZD5991 (1 µM, 24 h) between Capi-R and parental cells in LNCaP95 (C) and C4-2 (D). Floating bars (min to max) with line at mean are depicted. One-way ANOVA with Tukey’s post-hoc test was performed. Caspase 3/7 activity at 6 h (left panel) and cell viability at 24 h (right panel) in parental and Capi-R LNCaP95 (E) and C4-2 (F) cells treated with vehicle (DMSO), capivasertib (1 µM), AZD5991 (1 µM) and combined treatment. Two-way ANOVA with Tukey’s post-hoc test was performed. Cell viability and caspase 3/7 activity were determined using Caspase-Glo 3/7 2D assay and CellTiter-Glo 2D, respectively. Protein expression of cleaved PARP and cleaved caspase 3 (at 6 h; determined by western blot) in LNCaP95 (G) and C4-2 (H) treated with vehicle (DMSO), capivasertib (1 µM), AZD5991 (1 µM) and combined treatment (combo). Comparison of protein levels of BIM, BAD, BAK, total and p-AKTSer473 between parental and Capi-R cells in LNCaP95 (I) and C4-2 (J). Protein levels of total and p-BADSer136, total BAD, and p-AKTSer473 in response to vehicle (DMSO) and varying capivasertib concentrations (0.1 µM 0.5 µM, 1 µM, 5 µM) between parental and Capi-R cells in LNCaP95 (K) and C4-2 (L). Vinculin was used as a housekeeping protein. All the experiments were performed in three biological triplicates (apart from the western Blot shown in (H and J); n = 1) and technical singlets. The standard error of the mean is shown. Asterisks (*p  <  0.05; **p  <  0.01; ***p  <  0.001) indicate statistically significant differences between groups. Source data and exact p values are provided as a Source Data file.
Fig. 9
Fig. 9. AKT and CDK9 co-inhibition recapitulates the effects of AKT and MCL1 co-inhibition in vitro.
Caspase 3/7 activity (6 h), cell viability (24 h), and protein expression (cleaved PARP, cleaved caspase 3, MCL1, total and phospho-AKT Ser473; 6 h) were assessed in LNCaP95 (A) and C4-2 (B) cells treated with vehicle (DMSO), capivasertib (1 µM), ipatasertib (1 µM), fadraciclib (1 µM), and their combinations. GAPDH was used as a loading control. C Caspase 3/7 activity (6 h), cell viability (24 h), and protein expression (6 h) were evaluated in LNCaP95 (left) and C4-2 (right) cells following treatment with either capivasertib + AZD5991 or ipatasertib + fadraciclib, in the context of triple knockdown of BAK, BAD, and BIM (OnTarget siRNAs, 25 nM each for 72 h) or control siRNA (75 nM, 72 h). D Heatmaps show the effects of capivasertib, ipatasertib, fadraciclib, and their combinations on caspase 3/7 activity (6 h) and cell viability (24 h) in PNT2, LNCaP, C4-2, LNCaP95, 22Rv1, PC3, and DU145 cells, shown as fold change relative to vehicle. E Caspase 3/7 activity (6 h) and organoid viability (24 h and 96 h) were assessed in CP50c, CP253c, CP267c, CP336c, and CP142c PDX-derived organoids (PDX-Os) treated with vehicle, ipatasertib (1 µM), fadraciclib (1 µM), or the combination. Vehicle and ipatasertib data (dotted bars/symbols) are from the same experiment shown in Fig. 4D. F Caspase 3/7 activity (6 h) and cell viability (24 h and 96 h) were measured in Prostate Cancer Preclinical Mouse Modelling Platform organoids (ProMPt-Os) treated with vehicle, ipatasertib (1 µM), fadraciclib (1 µM), or the combination. All data represent three biological replicates with three (cell lines, ProMPt-Os) or five (PDX-Os) technical replicates. Bars show mean ± SEM. Statistical analysis was performed using one-way ANOVA with Tukey’s post-hoc test. Caspase 3/7 activity and viability were assessed using Caspase-Glo 3/7 and CellTiter-Glo in 2D (cell lines) or 3D (PDX-Os, ProMPt-Os) formats. Asterisks indicate statistical significance between groups (*p < 0.05; **p < 0.01; ***p < 0.001). Source data and exact p values are provided as a Source Data file.
Fig. 10
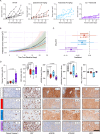
Fig. 10. AKT and CDK9 co-inhibition recapitulates the effects of AKT and MCL1 co-inhibition in vivo.
A Individual tumour volumes of CP253c treated with ipatasertib (50 mg/kg; n = 5), fadraciclib (40 mg/kg; n = 6), combined treatment (n = 6) and vehicle (n = 5). B Predicted tumour growth using a linear mixed-effect model of CP253c treated with ipatasertib (50 mg/kg; n = 5), fadraciclib (40 mg/kg; n = 5), combined treatment (n = 5) and vehicle (n = 5). C Forest plots showing the results from the longitudinal mixed effect model for log-transformed tumour volume. Estimates and p-values refer to the interaction term of treatment arm and time indicating the difference in tumour volume growth rate between each treatment arm and the vehicle arm. Points represent the random effect coefficients for each drug group and error bars the 95% confidence intervals. The black dotted line indicates the vehicle (reference level). D Comparison of protein expression for cleaved caspase 3 (% positive cells), Ki67 (% positive cells) and pGSK3B, pPRAS40 and MCL1 H-score for the different treatment arms. Necrotic samples were not analysed. The box shows the interquartile range, the line indicates the mean, and the whiskers represent the minimum and maximum values. One-way ANOVA with post-hoc Fisher’s LSD test was performed. Representative IHC micrograph for end-of-treatment CP253c tumours are also shown (bottom panel). The scale bar indicates a length of 100 µm. Source data are provided as a Source Data file.

References

    1. Mehtala, J. et al. Overall survival and second primary malignancies in men with metastatic prostate cancer. PLoS One15, e0227552 (2020). - PMC - PubMed
    1. Moreira, D. M. et al. Predicting time from metastasis to overall survival in castration-resistant prostate cancer: results from search. Clin. Genitourin. Cancer15, 60–66.e2 (2017). - PMC - PubMed
    1. Sumanasuriya S., De Bono J. Treatment of advanced prostate cancer-a review of current therapies and future promise. Cold Spring Harb. Perspect. Med. 8, a030635 (2018).
    1. Hanahan, D. & Weinberg, R. A. Hallmarks of cancer: the next generation. Cell144, 646–674 (2011). - PubMed
    1. Westaby, D. et al. Targeting the intrinsic apoptosis pathway: a window of opportunity for prostate cancer. Cancers. 14, 51 (2021).

MeSH terms

Substances

LinkOut - more resources