. 2025 Nov;647(8089):421-428.
doi: 10.1038/s41586-025-09448-3. Epub 2025 Oct 8.

Sperm sequencing reveals extensive positive selection in the male germline

Affiliations

Sperm sequencing reveals extensive positive selection in the male germline

Matthew D C Neville et al. Nature. 2025 Nov.

Abstract

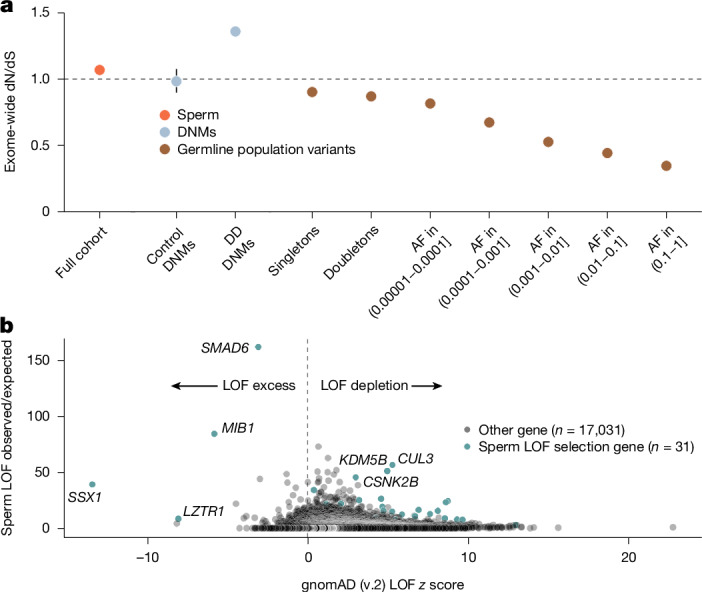
Mutations that occur in the cell lineages of sperm or eggs can be transmitted to offspring. In humans, positive selection of driver mutations during spermatogenesis can increase the birth prevalence of certain developmental disorders1-3. Until recently, characterizing the extent of this selection in sperm has been limited by the error rates of sequencing technologies. Here we used the duplex sequencing method NanoSeq4 to sequence 81 bulk sperm samples from individuals aged 24-75 years. Our findings revealed a linear accumulation of 1.67 (95% confidence interval of 1.41-1.92) mutations per year per haploid genome driven by two mutational signatures associated with human ageing. Deep targeted and exome NanoSeq5 of sperm samples identified more than 35,000 germline coding mutations. We detected 40 genes (31 newly identified) under significant positive selection in the male germline that have activating or loss-of-function mechanisms and are involved in diverse cellular pathways. Most of the positively selected genes are associated with developmental or cancer predisposition disorders in children, whereas four of the genes exhibited increased frequencies of protein-truncating variants in healthy populations. We show that positive selection during spermatogenesis drives a 2-3-fold increased risk of known disease-causing mutations, which results in 3-5% of sperm from middle-aged to older individuals with a pathogenic mutation across the exome. These findings shed light on germline selection dynamics and highlight a broader increased disease risk for children born to fathers of advanced age than previously appreciated.


Conflict of interest statement

Competing interests: I.M., M.R.S. and P.J.C. are co-founders, shareholders and consultants for Quotient Therapeutics. R.E.A. is an employee of Quotient Therapeutics. M.E.H. is a co-founder of, consultant to and holds shares in Congenica, a genetics diagnostic company. The remaining authors declare no competing interests.

Figures

Fig. 1
Fig. 1. Mutational burden and signature analysis in sperm and matched blood.
a,b, Substitutions (a) and indels (b) per haploid cell from whole-genome NanoSeq of sperm, trio paternal DNMs called with standard sequencing and clonal variants from seminiferous tubules of testis called with standard sequencing. Dots indicate single donors, except for testis with 1–15 samples per donor. c,d, Substitutions (c) and indels (d) per diploid cell for different ages from blood NanoSeq samples. e, Ratio of blood to sperm substitutions and indels per diploid cell per year. Each dot corresponds to an individual with both a blood and sperm sample. For individuals who had multiple time points, the mean value of all time points in that tissue was used. Box plots show the median as the centre line, the 25th and 75th percentiles as box limits and whiskers extending to the largest and smallest values within 1.5× the interquartile range from the limits from n = 57 biologically independent samples. f, Trinucleotide mutation counts in all sperm and blood samples. g, Contributions of the signatures SBS1, SBS5 and SBS19 in sperm and blood samples ordered by age. For ad, models are linear mixed regressions, with the central line showing the model fit and the shaded bands indicating 95% CIs calculated using parametric bootstrapping.
Fig. 2
Fig. 2. Germline positive selection.
ac, Genes with significant dN/dS ratios from exome-wide and restricted hypothesis tests. a, Mutation count split by mutation class. b, Enrichment over expectation of mutation classes. c, Mutation type driving dN/dS enrichment, COSMIC cancer gene tier, developmental disorder (DD) gene status in DDG2P and potential germline selection gene set. d,e, Observed sperm mutations across the cohort for CUL3 and SMAD4. The height of each lollipop represents the number of biologically independent samples with a mutation at that position, and the colour indicates mutation type. Mutations are labelled with their amino acid consequence or, for insertions (ins) and deletions (del), as in-frame (IF) or frameshift (FS). A ‘P’ indicates pathogenic/likely pathogenic classification in ClinVar. Exons are shown as purple rectangles and the blue background shows the total duplex coverage across the cohort. Lines below the gene indicate somatic mutations in cancer from COSMIC. f,g, dN/dS ratios for sperm SNVs across sets of individuals or genes, where the dotted black line indicates neutrality and the dotted orange line represents the cohort average across all genes. f, Exome-wide dN/dS ratios for younger, middle and older age groups of n = 11, n = 9 and n = 18 biologically independent sperm samples, respectively. g, Expression levels as log2 of unique molecular identifier (UMI) counts and cell-type clusters from single-cell sequencing of germ cells. Germ-cell types include undifferentiated and differentiated spermatogonial stem cells (SSCs), spermatocytes, round spermatids (spermatid 1) and elongating spermatids (spermatid 2). Data are from mutations detected in n = 38 biologically independent sperm samples. h, Observed/expected mutation rates in sperm for variant recurrence bins (data from COSMIC and DDD databases) using mutations from n = 38 biologically independent sperm samples. Data in fh show ratio point estimates, error bars indicate 95% CIs.
Fig. 3
Fig. 3. Pathogenic burden.
a, Estimated mean percentage of sperm in the cohort with a likely monoallelic disease mutation (left) or a driver mutation in a germline-selection gene (right). Disease mutations are divided into the fraction that was expected from the mutation model, the portion explained by driver variants and the portion unexplained. Driver mutations are split by those contributing to the disease mutations and the remainder, ‘ageing drivers’. b, Estimated percentage of sperm per individual with a driver mutation by age. c, Observed and expected percentages of sperm with a likely disease mutation by age. For b and c, the central line represents the model-predicted mean from quasibinomial regression, and shaded bands indicate 95% CIs. d, Cohort means from a split by gene and ordered by estimated mutation percentage. Per-gene contributions are shown above each gene; the summed contributions of all genes are shown below. Genes with four or fewer variants are grouped on the left with a condensed x axis for clarity.
Fig. 4
Fig. 4. Comparison with population variation.
a, Exome-wide dN/dS ratio point estimates across different variant sets, including n = 38 biologically independent sperm samples, DNMs from n = 1,886 healthy trios and n = 22,742 trios from the DDD cohort, and population variants from n = 125,748 individuals in gnomAD, split by allele frequency (AF). Error bars indicate 95% CIs. b, Observed/expected enrichment of missense and LOF (essential splice, nonsense or indel) variants in positively selected genes in sperm (x axis) from dN/dS models versus gnomAD (v.2) LOF z scores. Positive z scores indicate LOF depletion, whereas negative scores indicate excess over expected.
Extended Data Fig. 1
Extended Data Fig. 1. Sperm counting.
a,b,c, Slides of Papanicolaou stained semen samples for (a) an azoospermic sample where no sperm cells are visible, (b) an oligozoospermic sample where a small number of sperm samples are visible and (c) a normozoospermic sample where many sperm cells are visible. Sperm concentrations are given for each sample in millions of sperm per ml (M/ml). The black band in the bottom left of each slide photo corresponds to 100 µm. Staining was independently repeated once with similar results. d, The distribution of sperm counts on a log scale among semen samples analysed with colour bands indicating the concentration bin of the sample. All samples below 1 million/mL were subsequently excluded. e, The distributions of mutation burden per year from blood samples and three categories of sperm samples broken down by sperm concentration.
Extended Data Fig. 2
Extended Data Fig. 2. Sequencing method and coverage summary.
a, Graphical relationship between NanoSeq methods applied in manuscript. Both sperm and blood samples underwent genome NanoSeq, used for mutation burden and mutational signature analyses. Only sperm samples were used for targeted NanoSeq applied for selection, driver, and pathogenic variant analyses. Targeted NanoSeq is adaptable to different target panels, and we have named the sample sets as “targeted” for the samples using the 263 gene cancer panel and “exome” for samples using the exome wide panel. b, Mean duplex coverage (log scale) and percentage of genome covered (log scale) per sample. Panels summarise the mean duplex coverage (dx) and mean percentage of genome covered per NanoSeq type and tissue. c, Mutation burden of targeted (dark orange), exome (yellow), and genome (blue) sperm sequenced samples that were observed without correction (left), corrected for trinucleotide composition of covered base pairs relative to the whole genome (middle) or corrected and masked for mutations and coverage in the 44 genes linked to germline positive selection (right). Models are linear regressions, with the central line showing the model fit and the shaded bands indicating 95% confidence intervals.
Extended Data Fig. 3
Extended Data Fig. 3. Insertion deletion mutation profiles.
a,b, Distribution of indel types observed in whole genome (a) sperm and (b) blood.
Extended Data Fig. 4
Extended Data Fig. 4. Mutation rates relative to blood cell types and split by signatures.
a,b, Substitutions (a) and indels (b) per diploid cell from blood NanoSeq relative to specific blood cell types. c,d, Substitutions per haploid cell for sperm (c) and diploid cell for blood (d) split by signature contributions of SBS1, SBS5, and SBS19. a,b,c,d, Models are linear mixed regressions, with the central line showing the model fit and the shaded bands indicating 95% confidence intervals calculated by parametric bootstrapping. e, Ratio of age-corrected blood to sperm substitutions per diploid cell per year for mutations assigned to SBS1 and SBS5. Each dot corresponds to an individual with both a blood and sperm sample and where individuals had multiple timepoints the mean value of all timepoints in that tissue was used. Box plots show the median as center line, the 25th and 75th percentiles as box limits, and whiskers extending to the largest and smallest values within 1.5× the interquartile range from the limits from n = 57 biologically independent samples.
Extended Data Fig. 5
Extended Data Fig. 5. Model selection dN/dS.
a,b, Mean duplex coverage (a) and methylation percentage (b) of all base pairs with exome sequencing coverage split by mutation consequence. c, C > T mutation rate point estimates at CpG sites in n = 38 biologically independent exome-sequenced sperm samples split by methylation bin based on percentage methylated from testis bisulfite sequencing. d, Comparison of global dN/dS ratio point estimates from mutations of n = 38 exome-sequenced sperm samples using different modifications to the dNdScv algorithm. Categories include all nonsynonymous mutations, missense, nonsense or essential splice. The basic model excludes genes with no coverage and uses default parameters. Additional models show the impact of adding corrections for duplex coverage per base pair (BasePairCov), CpG methylation level (CpGmeth), and pentanucleotide context (Penta). e, Comparison of per-gene significance in exome-wide (blue) or restricted hypothesis (orange) dN/dS tests using the different models. Genes that did not reach significance in either test are shown in grey. Error bars indicate 95% confidence intervals.
Extended Data Fig. 6
Extended Data Fig. 6. Gene mutation mechanisms.
a, dN/dS ratios for sperm SNVs across germline selection genes and cancer gene census genes split by ten canonical cancer pathways, where the dotted black line indicates neutrality and the dotted orange line represents the cohort average across all genes. b, The mutation mechanism assigned to each gene based on the mutation pattern in sperm, developmental disorders, and cancer (Methods).
Extended Data Fig. 7
Extended Data Fig. 7. Gene mutation patterns.
a,b,c,d,e,f, Observed sperm mutations across the cohort for six illustrative genes where the height of the “lollipop” represents the number of unique samples with a mutation at that location and the colour represents its mutation type. Mutations are labelled with their amino acid consequence for point substitutions or their insertion (ins)/deletion (del) consequence of in frame (IF) or frameshift (FS). A “P” indicates that the variant is classified as pathogenic/likely pathogenic in ClinVar. Exons are shown as purple rectangles and the blue background represents the total duplex coverage across the cohort. Lines below the gene indicate COSMIC somatic mutations in cancer within that gene.
Extended Data Fig. 8
Extended Data Fig. 8. Mean variant class count per individual by age.
The relationship between age and the mean count of SNVs (non-coding, synonymous, missense, and loss-of-function (nonsense or essential splice)) and indels (non-coding indel and coding indel) per sperm cell. The red points represent the observed values for each individual. The grey line represents the expected mutation count per sperm based on the germline mutation rate model. Error bands indicate 95% confidence intervals of linear regressions.
Extended Data Fig. 9
Extended Data Fig. 9. Phenotype correlations.
Correlation of cohort phenotypes with mutation outcomes across sequencing datasets. Associations were tested using two-sided generalised linear models (family = gaussian). P values were adjusted for multiple comparisons using the false discovery rate (FDR) method. Asterisks indicate FDR-corrected P value ranges: (*P value > 0.01 to <0.05, **P value > 0.001 to <0.01, ***P value < 0.001).

References

    1. Goriely, A., McVean, G. A. T., Röjmyr, M., Ingemarsson, B. & Wilkie, A. O. M. Evidence for selective advantage of pathogenic FGFR2 mutations in the male germ line. Science301, 643–646 (2003). - PubMed
    1. Goriely, A. & Wilkie, A. O. M. Paternal age effect mutations and selfish spermatogonial selection: causes and consequences for human disease. Am. J. Hum. Genet.90, 175–200 (2012). - PMC - PubMed
    1. Wood, K. A. & Goriely, A. The impact of paternal age on new mutations and disease in the next generation. Fertil. Steril.118, 1001–1012 (2022). - PMC - PubMed
    1. Abascal, F. et al. Somatic mutation landscapes at single-molecule resolution. Nature593, 405–410 (2021). - PubMed
    1. Lawson, A. R. J. et al. Somatic mutation and selection at population scale. Nature10.1038/s41586-025-09584-w (2025).

LinkOut - more resources