. 2025 Nov;647(8089):436-444.
doi: 10.1038/s41586-025-09521-x. Epub 2025 Oct 8.

Sex and smoking bias in the selection of somatic mutations in human bladder

Affiliations

Sex and smoking bias in the selection of somatic mutations in human bladder

Ferriol Calvet et al. Nature. 2025 Nov.

Abstract

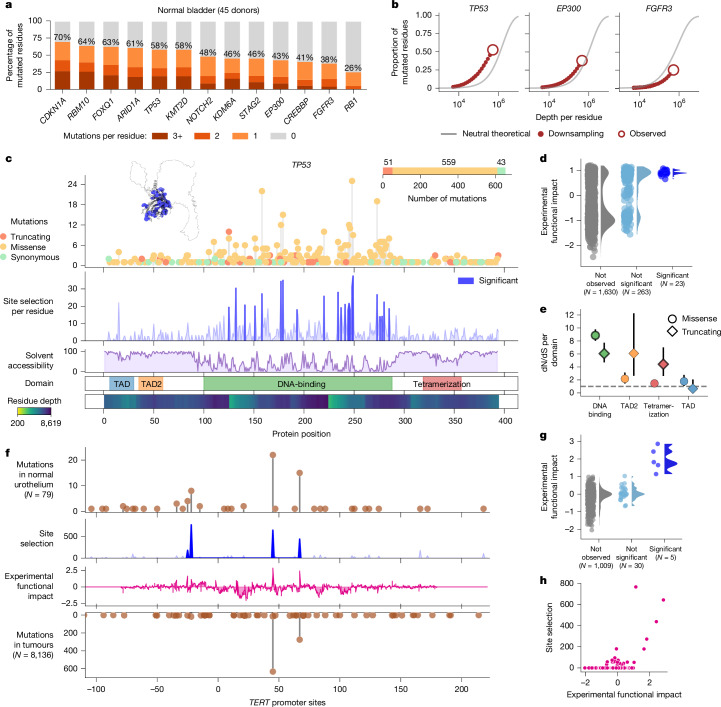
Men are at higher risk of several cancer types than women1. For bladder cancer the risk is four times higher for reasons that are not clear2. Smoking is also a principal risk factor for several tumour types, including bladder cancer3. As tumourigenesis is driven by somatic mutations, we wondered whether the landscape of clones in the normal bladder differs by sex and smoking history. Using ultradeep duplex DNA sequencing (approximately 5,000×), we identified thousands of clonal driver mutations in 16 genes across 79 normal bladder samples from 45 people. Men had significantly more truncating driver mutations in RBM10, CDKN1A and ARID1A than women, despite similar levels of non-protein-affecting mutations. This result indicates stronger positive selection on driver truncating mutations in these genes in the male urothelium. We also found activating TERT promoter mutations driving clonal expansions in the normal bladder that were associated strongly with age and smoking. These findings indicate that bladder cancer risk factors, such as sex and smoking, shape the clonal landscape of the normal urothelium. The high number of mutations identified by this approach offers a new strategy to study the functional effect of thousands of mutations in vivo-natural saturation mutagenesis-that can be extended to other human tissues.


Conflict of interest statement

Competing interests: R.A.R. is an equity holder at TwinStrand Biosciences Inc. and NanoString Technologies Inc. R.A.R. is named inventor on patent no. 11,479,807 (Methods for targeted nucleic acid sequence enrichment with applications to error corrected nucleic acid sequencing) owned by the University of Washington and licensed to TwinStrand Biosciences Inc. R.A.R. was a consultant at TwinStrand Biosciences Inc. and received research funding from a joint research grant with TwinStrand Biosciences Inc. and Ovartec GmbH. B.F.K. is an equity holder at NanoString Technologies Inc. The other authors declare no competing interests.

Figures

Fig. 1
Fig. 1. Ultradeep DNA sequencing of normal urothelium targeting driver genes shows thousands of mutations.
a, Schematic representation of sampling and duplex DNA sequencing of polyclonal epithelial brushes from normal bladders. b, Number of SNVs detected in a panel of selected genes in the normal bladder in this study and comparison with the number of mutations detected in 892 tumours from bladder cancer genomics studies, obtained from intOGen. c, Number and density of somatic mutations (SNVs, MNVs and indels up to 100 base pairs) identified in 79 samples of normal urothelium obtained from 45 donors. Bladder location (dome or trigone), age, sex and smoking history of donors are shown below the bar plots. d, Trinucleotide substitution profiles of the mutational signatures identified across this cohort of normal urothelium samples through de novo extraction. e, Top, scatter plot representing the relationship between the activity (number of mutations contributed) of SBS-ageing in samples and the age of donors; effect size, regression line and P value of a univariate mixed-effects linear model. Bottom, box plot representing the activity of SBS-chemo in donors exposed or not exposed to chemo/radiotherapy; effect size and P value of a univariate mixed-effects linear model. The boxplots show the quartiles with whiskers extending to the highest and lowest data points within 1.5 times the interquartile range; N = 79 samples for all plots in the panel. Mb, megabase. BioRender was used to create panel a (https://BioRender.com/fgnnet9).
Fig. 2
Fig. 2. Computing positive selection in the normal urothelium.
a, Distribution of truncating, missense and synonymous somatic mutations along the coding regions of RBM10 and TP53. Each needle represents the number of samples with mutations with one of the three consequences occurring on an amino acid residue. b, Magnitude of positive selection on truncating and missense mutations in RBM10 and TP53. Left, magnitude of positive selection indicated as the dN/dS ratio on the basis of the number of observed and expected mutations of each type. Right, percentage of driver mutations (observed in excess of neutrality) among truncating and missense in RBM10 and TP53. The number of observed, expected and estimated driver mutations are indicated for each gene. c, Magnitude of selection on truncating and missense mutations in FGFR3. dN/dS below 1 indicates negative selection. d, Magnitude of positive selection of activating mutations in the TERT promoter. Left, distribution of somatic mutations along the sequence of the TERT promoter colour coded according to whether they are activating (seen in tumours). Right, bar representing the magnitude of positive selection on activating TERT promoter mutations. In dN/dS bar plots (bd), the shaded segment in each bar represents the number of truncating or missense (or activating in the case of TERT) mutations expected under neutrality. The numbers above the bar detail the value of dN/dS for each type of mutation. Numbers inside bars represent the mutations in excess over the expectation, that is, the drivers. The P values in bd were calculated using a dN/dS approach (Omega) described in Supplementary Note 6.
Fig. 3
Fig. 3. Sex bias of the clonal landscape of normal urothelium.
a, Heatmaps with number of driver SNVs (top) and the total number of protein-affecting indels (bottom) in 13 genes across female and male donors. For donors with dome and trigone samples (marked with a dot), the number of driver SNVs in both samples has been added. Donors are sorted by age in ascending order. b, Relationship between age and the density (per Mb) of protein-affecting and non-protein-affecting mutations. c, Association of age with the protein-affecting (top coefficient) and non-protein-affecting (bottom coefficient) mutation density (left), and the magnitude of positive selection on missense (centre) and truncating (right) mutations of 13 genes (gene–mutation consequence combinations for which we could calculate dN/dS at the level of sample for at least 80% of samples were included in the calculation). d, Distribution of dN/dS truncating values of RBM10, CDKN1A, ARID1A and STAG2 and dN/dS missense values of TP53 among male and female donors. Horizontal lines denote the median. e, Association of sex with the protein-affecting (top coefficient) and non-protein-affecting (bottom coefficient) mutation density (left), and the magnitude of positive selection on truncating mutations in RBM10, CDKN1A, ARID1A and STAG2 (right). The plots represent the results of multivariate regressions accounting for age, smoking history, alcohol drinking history, BMI and exposure to chemotherapy. In all regressions (c and e), multivariate linear mixed-effects models (accounting for sex, smoking history, alcohol drinking history, BMI and exposure to chemotherapy) were used to account for the presence of several samples of the same donor, and these models yielded the effect size and P values. Circles represent the point estimate of the effect size of the regressions; horizontal lines represent 95% confidence intervals. Circles with dark outer circumference denote significant associations (false discovery rate (FDR) threshold of 0.2). N = 79 samples in b, c and e. All corrected P values for these regressions appear in Supplementary Table 7. F, female donors; M, male donors.
Fig. 4
Fig. 4. Association of activating mutations in the TERT promoter with smoking.
a, Number of activating (observed in tumours) and other (not observed in tumours) mutations in the TERT promoter across donors younger than 55 years (top), older than 55 years with no history of smoking (middle) or older than 55 years with a history of smoking (bottom). b, Density (mutations per Mb) of activating TERT promoter mutations observed in the three groups of donors. The horizontal line denotes the median of the distribution of the frequency of mutations in the group of donors older than 55 years with a history of smoking. The sample size of the three groups was 25 (samples from donors younger than 55), 14 (samples from donors older than 55 with no smoking history) and 38 (samples from donors older than 55 with smoking history), respectively. The two samples from a donor with unknown smoking history were excluded. c, Association between the frequency of activating mutations in the TERT promoter and the interaction between age and smoking history. A linear mixed-effects model was used to compute the P value. The circle represents the point estimate of the effect size of a multivariate linear mixed-effects regression, and the horizontal line represents 95% confidence intervals. The dark outer circumference denotes a significant association (FDR threshold of 0.2). The corrected P value appears in Supplementary Table 7. Number of samples for this analysis is the same as in a and b.
Fig. 5
Fig. 5. Natural saturation mutagenesis.
a, Percentage of amino acid residues in each gene with zero, one, two or three or more mutations across the 79 samples. b, Theoretical and observed kinetic of natural saturation mutagenesis for TP53, EP300 and FGFR3 as cumulative depth of sequencing increases. Grey line, theoretical kinetic of saturation mutagenesis (assuming no selection). Red circle, saturation achieved across the cohort. Red dashed line, observed kinetic (obtained by downsampling). c, Natural saturation mutagenesis of TP53 in normal bladder urothelium. From top to bottom, distribution of truncating, missense and synonymous mutations along the coding sequence of the gene; site selection computed for each amino acid residue of TP53 protein product; solvent accessibility along the protein sequence; TP53 protein product domains; duplex sequencing depth per amino acid residue. Left top, TP53 protein product three-dimensional structure with significant site selection of residues highlighted in blue. d, Experimental functional impact of TP53 mutations not observed, observed, or observed with significant site selection across the 79 samples. Only mutations with experimental functional impact reported in ref. are included. e, dN/dS truncating and dN/dS missense values for each domain of TP53 protein product. The vertical lines represent the 95% confidence intervals of the dN/dS estimate. Solid border represents significant dN/dS values (P value < 0.05) according to Omega (Supplementary Note 6); N = 79 samples. f, Natural saturation mutagenesis of the TERT promoter. From top to bottom, distribution of mutations; site selection computed for observed mutations; experimental functional impact values of mutations in the TERT promoter according to ref. ; distribution of mutations observed in the TERT promoter across 8,136 tumours (Supplementary Note 6). g, Experimental functional impact of mutations not observed, observed or observed in the TERT promoter with significant site selection across the 79 samples. h, Relationship between site selection and experimental functional impact value of all mutations observed in the TERT promoter.
Extended Data Fig. 1
Extended Data Fig. 1. Ultradeep sequencing of a mixture of urothelial clones.
a) Depth of DNA duplex sequencing across the 79 samples. The boxplots represent the distribution of sequencing depth across all genes included in the panel, while the dots represent the average sequencing depth obtained for each gene in each sample. b) Distribution of DNA duplex sequencing depth across the 16 genes. The boxplots represent the distribution of sequencing depth across all samples, and the dots represent the average sequencing depth per gene in each sample. c) Average DNA duplex sequencing depth obtained for each exon included in the panel, represented by the color of each tile according to the color scale in the colorbar on the right. White color represents the exon is not covered. Box plots in a and b display the quartiles with whiskers extending to the highest and lowest data points within 1.5 times the interquartile range. Details can be found in Supplementary Note 3.
Extended Data Fig. 2
Extended Data Fig. 2. Error rate of the DNA duplex sequencing technology.
a) Left panel, orange bars, mutations per sequenced nucleotide detected by the DNA duplex sequencing technology in this study using the same panel of bladder genes in cord blood DNA samples from three donors. Blue bars (for comparison), mutations per sequenced nucleotide detected by a similar technology (NanoSeq; data taken from ref. ) in two cord blood samples (Supplementary Note 4). Each bar presents the mutation density computed for a separate cord blood sample, with vertical lines representing the Poisson 95% confidence intervals. The comparison of the number of observed mutations per sequenced nucleotide with those expected in cord blood DNA based on prior studies (dashed red line, Supplementary Note 4) yields an estimate of the error rate of the technology of ~4 × 10⁻⁸ per sequenced nucleotide. Right panel, comparison of the estimated error rate by both technologies with the mutations per sequence nucleotide across the 79 normal urothelial samples included in this study (rightmost red bar). It shows that the rate of errors of the DNA duplex sequencing technology used in the study is approximately 25 times smaller than the mutation density detected in the normal urothelium. (N = 3 for cord blood DNA duplex sequencing). b) Mutational profile of normal urothelium obtained through two orthogonal approaches. Top panel, profile constructed using mutations detected through laser capture microdissection (LCM) of clonal or quasi-clonal samples followed by regular shallow whole-genome sequencing (data taken from ref. ). Bottom panel, profile constructed using mutations detected in this study from ~2 cm2 brushes followed by ultradeep DNA duplex sequencing. c) Relationship between the mutation density calculated in normal bladder urothelium using two orthogonal approaches. The red dots correspond to the rate of mutations detected through laser capture microdissection of clonal or quasi-clonal samples followed by regular shallow whole-exome sequencing (WES LCMs; data taken from ref. ). The blue dots correspond to the rate of mutations computed for the 79 samples in this study from ~2 cm2 brushes followed by ultradeep DNA duplex sequencing. The trend line represented in the plot was calculated from the WES LCMs samples. For more details on the error rate of the technology, see Supplementary Note 4.
Extended Data Fig. 3
Extended Data Fig. 3. Mutational signatures active across the cohort.
a) Mutational profile of the signatures identified using SigProfiler. b) Mutational profile of the signatures identified using HDP. c) Activity of the signatures identified using SigProfiler across the 79 samples. d) Activity of the signatures identified using HDP across the 79 samples. For more details on the identification of these mutational signatures and the decipherment of their etiology, see Supplementary Note 5.
Extended Data Fig. 4
Extended Data Fig. 4. Calculation of positive selection.
a) Five signals of positive selection on the mutations observed in TP53 in all samples. The first three rows show the distribution of truncating (nonsense and splice-site affecting), synonymous, and missense mutation across the coding region of TP53. On the right side, dN/dS truncating (top row) and dN/dS missense (third row) represent the estimation of the excess of truncating and missense mutations, respectively, over the neutral expectation calculated from the observed synonymous variants (second row). The magnitude of the neutral expectation is indicated inside of the horizontal bars with shaded diagonal lines and the p-value corresponds to the Omega implementation of dN/dS (Supplementary Note 6). Fourth row, 3D clustering score of missense mutations (blue line) compared to the neutral expectation (gray line), along with detected 3D clusters of missense mutations (filled light blue line). The right-hand panel represents the distance between the distribution of expected 3D clustering scores of the residue with the highest observed score (gray) and the observed score itself (vertical dashed lines), used to compute an empirical p-value (Supplementary Note 6). Fifth row, functional impact score of SNVs (synonymous, missense and truncating) observed in the protein. The right-hand panel represents the distance between mean expected functional impact scores (gray areas) and the observed average functional impact score (vertical dashed lines), used to compute an empirical p-value (Supplementary Note 6). Sixth row, deviation in the ratio of frameshift (purple) to inframe (brown) indels in the gene compared to the ratio of non-3n to 3n (a length multiple of three nucleotides) indels in neighboring non-coding regions (excess of frameshift indels). The right-hand bars represent the numbers of coding frameshift and inframe indels and non-coding non-3n to 3n indels. Analytical or empirical tests used to calculate the p-values shown in the different panels are described in Supplementary Note 6. P-values for all genes computed using all methods appear in Supplementary Table 6. b) Magnitude of all signals of positive selection calculated for 14 genes on the pooled mutations of the 79 samples. Dashed lines for truncating, missense and indels indicate an equal number of observed and expected mutations of each type (dN/dS =1, that is, no selection). In 3D clustering the size of the circles is proportional to the difference between observed and expected scores. In functional impact bias, the size of the circles is proportional to the Z-score. c) Comparison of the excess of truncating mutations (dN/dS truncating, top) and the excess of missense mutations (dN/dS missense) calculated taking into account every observed mutation only once (as used in the manuscript, and represented by the unshaded bars in each plot) and taking into account the number of DNA duplex reads supporting each mutation (bars shaded with diagonal line pattern). d) Positive selection on mutations in PIK3CA. Left panel, needleplot representing the distribution of missense, truncating and synonymous mutations in the region of PIK3CA covered by sequencing reads. Right panel, magnitude of positive selection on missense mutations across the 79 samples calculated using the Omega dN/dS approach. The p-value is calculated using the Omega implementation of the dN/dS approach described in Supplementary Note 6. The p-value appears in Supplementary Table 6.
Extended Data Fig. 5
Extended Data Fig. 5. Calculation of positive selection at the sample level.
a) dN/dS truncating values for RBM10 and TP53 in the dome of donors 04 and 09. All legends as defined in Fig. 2. The p-values are calculated using the Omega implementation of the dN/dS approach described in Supplementary Note 6, and appear in Supplementary Table 6. b) Landscape of the fraction of urothelium covered by driver mutations of each gene in the panel. The values of covered urothelium have been discretized. In most cases, the percentage of urothelium covered by driver mutations of each gene falls in the lowest categories. The right-hand graph shows stacked barplots with the distribution of samples in different categories of covered urothelium across genes. c) Agreement of the magnitude of dN/dS missense (top) and dN/dS truncating (bottom) calculated for all genes in the dome and trigone of donors 14, 04 and 23. R-squared (R²), Pearson’s correlation coefficient of the dN/dS values calculated for the dome and trigone samples from each donor. The p-values corresponding to the Pearson’s correlation coefficients are shown.
Extended Data Fig. 6
Extended Data Fig. 6. Similarity between dome and trigone.
a) Top, number of SNVs that are shared between the dome and trigone samples (or unique to each of them) of donors for which both areas were brushed. Bottom, percentage of SNVs found in the trigone sample of each individual that are shared with the dome sample of the same individual (top), of SNVs found in the dome that are shared with the trigone (middle), and Jaccard index measuring the overlap of the SNVs identified within both samples (bottom). b) Distribution of Jaccard Index values of SNVs (first at the left), missense mutations (second), truncating mutations (third), and non-protein affecting mutations (last to the right) shared between the dome and trigone samples of the same individual and pairs of samples from different donors. The Jaccard index obtained for any subset of mutations is significantly higher for the dome and trigone samples of the same donor (p-values from one-tailed Wilcoxon-Mann–Whitney test). N indicates the number of sample pairs. c) Comparison of the distribution of Pearson’s correlation coefficients comparing dN/dS values between dome and trigone samples of the same donor (as done in Extended Data Fig. 5c) or from different donors. In the first boxplot, all mutations are included in the calculation of dN/dS values, while in the second, mutations shared between dome and trigone of the same donor are excluded. The correlation is significantly higher between dome-trigone pairs of samples of the same donor than of different donors (p-values from one-tailed Wilcoxon-Mann–Whitney test). Only pairs of samples for which Omega values of at least two genes could be computed are included in the boxplots. N indicates the number of sample pairs. Box plots in b and c display the quartiles with whiskers extending to the highest and lowest data points within 1.5 times the interquartile range.
Extended Data Fig. 7
Extended Data Fig. 7. Tolerance of dN/dS values to errors.
a) Measurement of the tolerance of RBM10 dN/dS truncating to artifactual mutations (artifacts) following the BotSeq mutational profile. The boxplots represent the distribution of dN/dS values calculated from 100 synthetic samples with increasing rates of injected artifacts between 0 and 1 × 10⁻⁷ (one order of magnitude higher than estimated for the technology), and for increasing values of ground truth dN/dS (between 1 and 50). The boxplots display the quartiles with whiskers extending to the highest and lowest data points within 1.5 times the interquartile range. N = 100 synthetic samples. b) Average percentage of RBM10 dN/dS truncating reconstructed value across 100 synthetic samples, calculated by computing which fraction of the ground truth dN/dS in a sample is obtained upon calculation. c) Summary of the results of the experiment of error tolerance. Left panel, average percentage of reconstructed ground truth dN/dS across synthetic samples (for all genes and all ground truth dN/dS explored altogether) that is calculated upon injection of increasing rates (x-axis) of different types of artifacts (color legend). Center plot, average percentage of reconstructed ground truth dN/dS across synthetic samples (for all genes and all artifacts altogether) that is calculated upon injection of increasing rates (x-axis) for different values of ground truth dN/dS (color legend). Right panel, average percentage of reconstructed ground truth dN/dS across synthetic samples (for all ground truth dN/dS explored and all artifacts altogether) for different genes (color legend), that is calculated upon injection of increasing rates (x-axis) of artifacts.
Extended Data Fig. 8
Extended Data Fig. 8. Heterogeneous clonal landscape and power calculation.
a) From simulated datasets reflecting the same distributional features and data dependencies found in the study cohort, we computed the statistical power as the proportion of times the variable of interest (sex) came out significant in the univariate linear mixed-effects regression against truncating dN/dS. In this analysis the female group was picked as the baseline group. We simulated data with different ground truth female baselines (expected truncating dN/dS among females) and between-group differences (effect size). For each baseline-effect combination we can draw a power value, which are represented collectively in the form of these power profiles (see Supplementary Note 10). For the two exemplary genes RBM10 and ARID1A we highlight the profile curves corresponding to their observed baselines in the cohort and the projected power given the inferred effect in the cohort. b) Table presenting a summary of the five associations found between dN/dS and sex in the study. Here we briefly define the meaning of each column. See also Supplementary Note 10 for a more in-depth account on the methodology. CSQN: Either missense or truncating, represents the specific dN/dS used as response variable in the association analysis. ESTIMATE: Coefficient of the binary variable of interest (“is_male”) inferred via linear-mixed effects regression against dN/dS using the donor as a random intercept. CI_LOW, CI_HIGH: Lower and upper 95% CI bounds of ESTIMATE. PVAL: p-value associated with the variable of interest in the regression analysis. INTERCEPT: Inferred intercept in the regression analysis. BASELINE: Average CSQN-specific dN/dS value in the baseline group of samples (female). INTERCEPT and BASELINE are expected to follow closely one another. COVARIATE: The (binary) explanatory variable representing sex. POWER: Statistical power corresponding to the BASELINE and ESTIMATE in the power profile. EFFECT_PVAL: The “effect p-value” is an ad-hoc metric that we defined as the proportion of times the sex coefficient attains a value at least as high as ESTIMATE upon regression with a dataset corresponding to BASELINE and zero ground-truth effect. It can be thought of as an effect-aware false positive rate. c) Frequency of tumor samples with missense or truncating mutations of 6 genes in males and females across a cohort of 2,965 bladder carcinomas from the GENIE cohort. d) Multivariate logistic regression (including age) of sex on mutations in the 6 genes. Circles represent the point estimate of the effect size of the linear regression, and the horizontal line, the 95% confidence intervals. Circles with dark outer circumference denote significant associations (FDR threshold of 0.2). e) Distribution of expected number of mutations in the two TERT promoter mutational hotspots (chr5:1295113 and chr5:1295135) across donors younger than 55 years old or never smokers assuming a mutation rate equal to that observed across ever smokers older than 55 years old. The red dashed vertical line represents the actual observed number of mutations in the two hotspots across donors younger than 55 years or never smokers. The p-value was calculated empirically based on 10,000 randomizations, as described in Supplementary Note 10. f) Maximum variant allele frequency detected for activating TERT promoter mutations in a sample vs the number of activating TERT promoter mutations (i.e. mutations observed in tumors, see main text) identified in a sample. The observation of different activating TERT promoter mutations in the same sample indicates the existence of convergent evolution of TERT promoter mutations. This, in turn, suggests that the observation of mutations with large variant allele frequency may also represent multiple mutated clones with the exact mutations (convergent evolution) rather than very large clones.
Extended Data Fig. 9
Extended Data Fig. 9. Calculations of natural selection mutagenesis.
a) Comparison of the density of protein affecting mutations in 14 genes across two cohorts of bladder tumors (muscle invasive and non-muscle invasive) and in the normal urothelium of the 45 donors. Mutation density in tumors is calculated by dividing the number of observed mutations (normally 1) by the gene length in megabases (Mb). b) Percentage of amino acid residues in each gene with zero, one, two, or three or more mutations observed across 892 bladder tumor samples from the intOGen cohort. The order of the genes is as in Fig. 5a to facilitate visual comparison. c) Theoretical and observed curves of saturation mutagenesis for genes not shown in Fig. 5b. The grey dashed line represents the kinetic of saturation mutagenesis under the theoretical assumption of no selection, in which mutations are observed based only on their neutral probability of occurrence. The red circle denotes the degree of saturation achieved by probing the 79 samples in the cohort. The red dashed line is constructed through successive depth down-samples of the current observation and represents the observed kinetic of natural saturation mutagenesis (see details in Supplementary Note 12). d) Natural saturation mutagenesis of EP300 in normal bladder urothelium. Besides the tracks described in Fig. 5c for TP53, 3D clusters obtained via Oncodrive3D (second), dN/dS truncating and dN/dS missense values for each exon (fourth), and the distribution of tumor mutations (from intOGen; see Methods) along the sequence of the gene (last) have been added. These same types of plots are presented for the rest of genes in the study in Supplementary Figs. 2 and 3. Right plot, EP300 3D structure with residues with significant site selection highlighted in blue. e) dN/dS truncating and dN/dS missense values for each domain of EP300. The vertical lines represent the 95% confidence intervals of the dN/dS estimate. Solid border represents significant dN/dS values (p-value < 0.05) according to Omega (Supplementary Note 6). N = 79 samples.
Extended Data Fig. 10
Extended Data Fig. 10. Application of natural saturation mutagenesis.
a) Manhattan plot illustrating the strength of site selection for all genomic sites included in the sequencing panel. Some of the mutations in the sites with strongest selection are indicated. b) Application of site selection values to TP53 mutations. In all plots, TP53 tumor mutations observed in two large cohorts (intOGen, N = 33,218 and GENIE, N = 109,017) are grouped depending on whether they have been observed across bladder normal samples in this study and their site selection (i.e., not observed, observed with non-significant site selection and observed with significant site selection). Left top panel, distribution of the frequency across intOGen tumors of the three groups of mutations. Right top panel, distribution of the frequency across GENIE tumors. Left bottom panel, boostDM (machine learning models for in silico saturation mutagenesis) scores of the three groups of mutations. Right bottom panel, proportion of mutations annotated or not annotated as oncogenic in ClinVar or OncoKB. c,d) Distribution of the solvent accessibility of sites with mutations in each group for TP53 (c) and EP300 (d). e) Application of site selection values to TERT promoter mutations. Mutations observed in two large cohorts of tumors (or the subset of bladder tumors in GENIE) are grouped depending on whether they have been observed across normal samples and their site selection into not observed, observed with non-significant site selection and observed with significant site selection. Left, distribution of the frequency across tumors in a large cohort of whole-genome sequenced samples (N = 8,136) of the three groups of mutations. Center, distribution of the frequency across all GENIE tumors (N = 109,017) of the three groups of mutations. Right, distribution of the frequency across GENIE bladder tumors (N = 3,909) of the three groups of mutations.

References

    1. Jackson, S. S. et al. Sex disparities in the incidence of 21 cancer types: quantification of the contribution of risk factors. Cancer128, 3531–3540 (2022). - PMC - PubMed
    1. Doshi, B., Athans, S. R. & Woloszynska, A. Biological differences underlying sex and gender disparities in bladder cancer: current synopsis and future directions. Oncogenesis12, 44 (2023). - PMC - PubMed
    1. Jha, P. Avoidable global cancer deaths and total deaths from smoking. Nat. Rev. Cancer9, 655–664 (2009). - PubMed
    1. Martincorena, I. Somatic mutation and clonal expansions in human tissues. Genome Med.11, 35 (2019). - PMC - PubMed
    1. Kakiuchi, N. & Ogawa, S. Clonal expansion in non-cancer tissues. Nat. Rev. Cancer21, 239–256 (2021). - PubMed

MeSH terms