. 2025 Oct 7;6(10):e70425.
doi: 10.1002/mco2.70425. eCollection 2025 Oct.

Cuproptosis Facilitates Chronic Skin Inflammation by Regulating the α-Ketoglutarate/H3K4me3/Ferritin Heavy Chain 1 Signaling Pathway-Mediated Ferroptosis

Affiliations

Cuproptosis Facilitates Chronic Skin Inflammation by Regulating the α-Ketoglutarate/H3K4me3/Ferritin Heavy Chain 1 Signaling Pathway-Mediated Ferroptosis

Pian Yu et al. MedComm (2020). .

Abstract

Dysregulated copper homeostasis is implicated in inflammatory skin diseases such as psoriasis and atopic dermatitis (AD), but the role of cuproptosis remains poorly defined. This study aimed to elucidate the role and mechanism of cuproptosis in inflammatory skin diseases. Transcriptome analysis of patient lesions revealed significant alterations in cuproptosis-related genes correlating with disease-specific pathological features. These cuproptosis-related gene expression signatures demonstrated strong clinical relevance to therapeutic efficacy in both psoriasis and AD cohorts. Functional validation using disease models showed that pharmacologically inhibiting cuproptosis with the copper chelator tetrathiomolybdate (TTM), or genetically knocking down the copper importer SLC31A1, effectively alleviated chronic skin inflammation and hallmark pathological changes induced by imiquimod (IMQ) or calcipotriol (MC903). Mechanistically, we uncovered that SLC31A1-mediated cuproptosis promotes intracellular α-ketoglutarate (α-KG) accumulation, driving activation of the lysine demethylase KDM5B. Activated KDM5B specifically demethylates H3K4me3 marks at the promoter of the ferroptosis regulator ferritin heavy chain 1 (FTH1), suppressing its transcription and consequently sensitizing keratinocytes to ferroptotic cell death, thereby amplifying inflammatory tissue damage. Our findings establish a fundamental pathogenic SLC31A1/KDM5B/FTH1 molecular axis linking dysregulated copper metabolism and cuproptosis to ferroptosis execution in psoriasis and AD, providing significant mechanistic insights and pinpointing promising therapeutic targets for these refractory skin disorders.

Keywords: cuproptosis; ferroptosis; fth1; h3k4me3; inflammatory skin diseases; slc31a1.


Conflict of interest statement

The authors declare no conflicts of interest.

Figures

FIGURE 1
FIGURE 1
Analysis of cuproptosis‐related indicators. (A) Cuproptosis mechanism diagram. (B) The boxplot of cuproptosis‐related genes expressions in AD patients. (C) The boxplot of cuproptosis‐related genes expressions in psoriasis patients. (D) The UMAP plot of imbalanced copper homeostasis cells in AD and psoriasis (group by samples). (E) The UMAP plot of imbalanced copper homeostasis cells in AD and psoriasis (group by cell types). (F) The boxplot of cuproptosis‐GeneUp score and Cuproptosis‐GeneDown score of imbalanced copper homeostasis cells in AD. (G) The boxplot of cuproptosis‐GeneUp score and Cuproptosis‐GeneDown score of imbalanced copper homeostasis cells in psoriasis. (H) The number of different cell types exhibiting imbalanced copper homeostasis in AD. (I) The number of different cell types exhibiting imbalanced copper homeostasis in psoriasis. (J) The changes of cuproptosis‐related genes expressions in AD patients with Dupilumab treatment. (K) The changes of cuproptosis‐related genes expressions in psoriasis patients with different treatment. *p < 0.05, **p < 0.01, ***p < 0.001, ****p < 0.0001.
FIGURE 2
FIGURE 2
TTM alleviates cuproptosis in AD and psoriasis‐like dermatitis. (A) Mice were treated with ethanol and MC903 for 12 days (discontinued on days 6 and 7) to construct the AD‐like dermatitis model. Mice were treated with Vaseline and IMQ for 7 days to establish psoriasis‐like dermatitis. Mice were treated with TTM (20 mg/kg in AD, 40 mg/kg in psoriasis) by intragastric administration every day. (B) Copper ion levels in each group. (C) ROS levels in each group. (D) GSH levels in each group. (E) Transcription levels of iron–sulfur cluster proteins (Fdx1, Lias, and Aco‐2) and copper ion channels (Atp7a, Atp7b, and Slc31a1) in each group by qRT‐PCR. (F) Protein levels of iron–sulfur cluster proteins (FDX1 and LIAS) and the oligomerization of lipidated protein (DLAT) in each group by western blotting. (G) Expression of FDX1 in mice detected by IHC. n = 5. Scale bar = 200 µm. Graphs indicate the mean ± SD of each group. *p<0.05, **p<0.01, ***p<0.001.
FIGURE 3
FIGURE 3
TTM alleviate AD and psoriasis‐like dermatitis. (A) Mice were treated with ethanol and MC903 for 12 days (discontinued on days 6 and 7) to construct the AD‐like dermatitis model. Mice were treated with Vaseline and IMQ for 7 days to establish psoriasis‐like dermatitis. Mice were treated with TTM (20 mg/kg in AD, 40 mg/kg in psoriasis) by intragastric administration every day. Phenotypic presentation and H&E staining as well as statistical analysis of the epidermal thickness of the ears in mice. Scale bars = 200 µm. (B) The severity scoring of skin lesions, the ear thickness, dermatitis scores, erythema, and scratch times in 30 min as well as the statistical analysis were used to evaluate AD. The erythema, scales, infiltration, and PASI scores were used for evaluating psoriasis. (C) mRNA levels of inflammatory factors (Il4, Il5, Il13, Tslp, Il31, and Ifng were used for evaluating AD; Il17a, Il1b, Tnf, Il22, S100a8, and S100a9 were used for evaluating psoriasis) associated with dermatitis in each group by qRT‐PCR. (D) Representative flow cytometric plots and quantification of the Th17 cell percentage gated on the CD4+ T cells in each group. n = 5. *p < 0.05, **p < 0.01, ***p < 0.001.
FIGURE 4
FIGURE 4
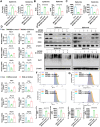
Fth1 is a bridge molecule for cross‐talk between cuproptosis and ferroptosis. (A) In KCs‐Corneum cells of psoriasis, the differentially expressed genes between imbalanced copper homeostasis cells and other cells. (B) The top eight differentially down‐expressed genes of (A). (C) The correlation analysis between FTH1 and SLC31A1 expression of normal skin tissues in GEPIA database. (D and E) The bivariate factor (SLC31A1 and FTH1) model evaluate by ROC curve in AD and psoriasis datasets. (F) The ROC curve of external validation of (E) in psoriasis dataset. (G) Expression of FTH1 in skin tissues of AD patient groups detected by IHC, scale bars = 200 µm, n = 5. (H) Expression of FTH1 in skin tissues of psoriasis patient groups detected by IHC, scale bars = 200 µm, n = 5. (I) Mice were treated with ethanol and MC903 for 12 days (discontinued on days 6 and 7) to construct the AD‐like dermatitis model. Mice were treated with Vaseline and IMQ for 7 days to establish psoriasis‐like dermatitis. Mice were treated with TTM (20 mg/kg in AD, 40 mg/kg in psoriasis) by intragastric administration every day. The mRNA level of Fth1 by qRT‐PCR in each group. (J) The protein level of FTH1 by western blotting in each group. (K) The expression of FTH1 detected by IHC in each group in mice, scale bars = 200 µm, n = 5; *p < 0.05, **p < 0.01, ***p < 0.001. (L) Fe2+ level detected by Ferrorange using flow cytometry in each group. (M) Lipid peroxidation levels by C11‐BODIPY581/591 using flow cytometry in each group. n = 3. *p < 0.05, **p < 0.01, ***p < 0.001.
FIGURE 5
FIGURE 5
α‐KG inhibits FTH1 expression through demethylation of H3K4me3. (A) Mice were treated with ethanol and MC903 for 12 days (discontinued on days 6 and 7) to construct the AD‐like dermatitis model. Mice were treated with Vaseline and IMQ for 7 days to establish psoriasis‐like dermatitis. Metabolomics sequencing was performed on the ear tissue of mice after modeling. The complex heatmap of differential metabolites. (B) The KEGG clustering of differential metabolites. (C and D) Mice were treated with ethanol and MC903 for 12 days (discontinued on days 6 and 7) to construct the AD‐like dermatitis model. Mice were treated with Vaseline and IMQ for 7 days to establish psoriasis‐like dermatitis. Mice were treated with TTM (20 mg/kg in AD, 40 mg/kg in psoriasis) by intragastric administration every day. Si‐Slc31a1 was applied to the back skin (2.5 nmol) every other day. The content of epidermic α‐KG. (E and F) Primary KCs were extracted from human foreskin tissue, and KCs were treated with 0–0.8 mM α‐KG for 48 h; the expression of FTH1 was detected by qRT‐PCR and WB. (G) Inflammatory and chemotactic factors were detected by qRT‐PCR after HaCaT treating with si‐mock, si‐Slc31a1, IL17A, or α‐KG for 48 h. (H) JB6 cells were transfected with either the non‐targeting siRNA or Kdm5b siRNA. Kdm5b mRNA level was measured by qRT‐PCR. (I) JB6 cells were transfected with either the non‐targeting siRNA or Kdm5b siRNA. FTH1 protein level was measured by western blotting, β‐actin served as a loading control. H3K4me3 protein level was measured by western blotting, and H3 served as a loading control. (J) Mice were treated with Vaseline and IMQ for 7 days to establish psoriasis‐like dermatitis. GSK467 was injected into the abdomen every other day (10 mg/kg). Collected the epidermis tissue. (K) Mice were treated with Vaseline and IMQ for 7 days to establish psoriasis‐like dermatitis. GSK467 was injected into the abdomen every other day (10 mg/kg). Phenotypic presentation in mice. Scale bars = 200 µm; (L) The PASI scores were used to evaluate psoriasis. (M) Representative flow cytometric plots and quantification of the Th17 cell percentage gated on the CD4+ T cells in each group. n = 5. (N) mRNA levels of Il23a, Il17a, Cxcl3, S100a8, and S100a9. (O) mRNA level of Fth1. (P) The expression of H3K4me3 in KCs detected by western blotting after treating with si‐SLC31A1, IL17A, and α‐KG for 48 h. (Q) ChIP–qPCR assays for H3K4me3 binding to the FTH1 promoter sites in KCs with or without si‐SLC31A1 treatment; n = 3. *p < 0.05, **p < 0.01, ***p < 0.001.
FIGURE 6
FIGURE 6
Knockdown of Slc31a1 alleviate AD and psoriasis‐like dermatitis. (A) Mice were treated with ethanol and MC903 for 12 days (discontinued on days 6 and 7) to construct the AD‐like dermatitis model. Mice were treated with Vaseline and IMQ for 7 days to establish psoriasis‐like dermatitis. Si‐Slc31a1 was applied to the back skin (2.5 nmol) every other day. (B) Phenotypic presentation and H&E staining as well as statistical analysis of the epidermal thickness of the back in mice. Scale bars = 200 µm, n = 5. (C) The expression of SLC31A1 in each group detected by IHC. Scale bars = 200 µm, n = 5. (D) The expression of epidermic Slc31a1 detected by qRT‐PCR in each group. (E) Representative flow cytometric plots and quantification of the Th17 percentage gated on the CD4+ T cells in each group. n = 5. (F) mRNA levels of inflammatory factors (Il4, Il5, Il13, Tslp, Il31, and Ifng were used for evaluating AD; Il17a, Il1b, Tnf, Il22, S100a8, and S100a9 were used for evaluating psoriasis) associated with dermatitis in each group by qRT‐PCR; n = 5. *p < 0.05, **p < 0.01, ***p < 0.001.
FIGURE 7
FIGURE 7
Knockdown of Slc31a1 could reduce cuproptosis in inflammatory skin diseases and inhibit ferroptosis through Fth1. (A) Mice were treated with ethanol and MC903 for 12 days (discontinued on days 6 and 7) to construct the AD‐like dermatitis model. Mice were treated with Vaseline and IMQ for 7 days to establish psoriasis‐like dermatitis. Si‐Slc31a1 was applied to the back skin (2.5 nmol). Copper ion levels in each group. (B) ROS levels in each group. (C) GSH levels in each group. (D) Transcription levels of iron–sulfur cluster proteins (Fdx1, Lias, Aco‐2, and Sdhb) and copper ion channels (Atp7a and Atp7b) in each group by qRT‐PCR. (E) Protein levels of iron–sulfur cluster proteins (FDX1 and LIAS), FTH1, and the oligomerization of lipidated protein (DLAT) in each group by western blotting. (F) Fe2+ level detected by Ferrorange using flow cytometry in each group. (G) Lipid peroxidation levels by C11‐BODIPY581/591 using flow cytometry in each group. n = 5. *p < 0.05, **p < 0.01, ***p < 0.001.

References

    1. Festa R. A. and Thiele D. J., “Copper: An Essential Metal in Biology,” Current Biology 21, no. 21 (2011): R877–R883. - PMC - PubMed
    1. Shiva S., Wang X., Ringwood L. A., et al., “Ceruloplasmin Is a NO Oxidase and Nitrite Synthase That Determines Endocrine NO Homeostasis,” Nature Chemical Biology 2, no. 9 (2006): 486–493. - PubMed
    1. Linder M. C. and Hazegh‐Azam M., “Copper Biochemistry and Molecular Biology,” American Journal of Clinical Nutrition 63, no. 5 (1996): 797S–811S. - PubMed
    1. Babak M. V. and Ahn D., “Modulation of Intracellular Copper Levels as the Mechanism of Action of Anticancer Copper Complexes: Clinical Relevance,” Biomedicines 9, no. 8 (2021): 852. - PMC - PubMed
    1. Kim B.‐E., Nevitt T., and Thiele D. J., “Mechanisms for Copper Acquisition, Distribution and Regulation,” Nature Chemical Biology 4, no. 3 (2008): 176–185. - PubMed

LinkOut - more resources