. 2025 Oct 7:8:0922.
doi: 10.34133/research.0922. eCollection 2025.

PCSK9 Promotes Atherosclerotic Plaque Instability by Inducing VSMC Ferroptosis through the YAP1-NUPR1 Axis

Affiliations

PCSK9 Promotes Atherosclerotic Plaque Instability by Inducing VSMC Ferroptosis through the YAP1-NUPR1 Axis

Yuting Cui et al. Research (Wash D C). .

Abstract

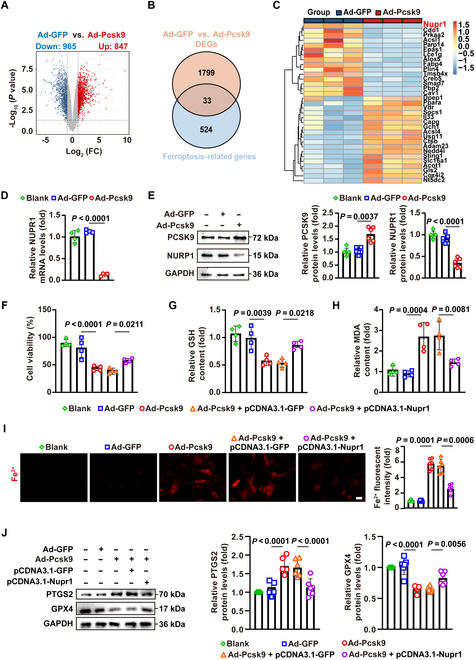
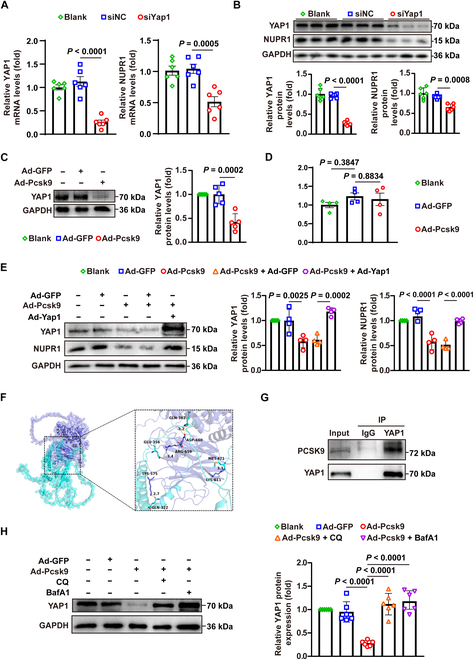
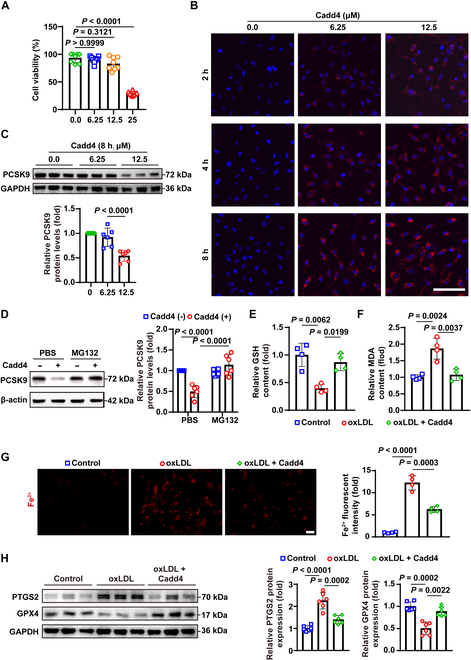
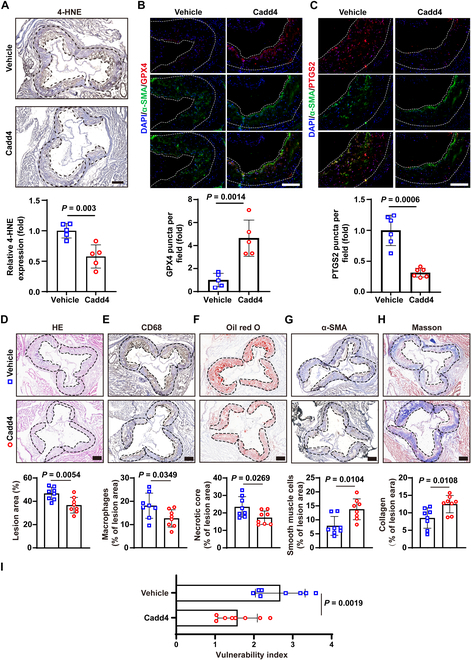
Atherosclerosis persists as a principal driver of global cardiovascular mortality and morbidity, and its sustained prevalence surge fuels the incidence of major adverse cardiovascular events (MACE). Plaque instability is a critical determinant of MACE, as fissure formation or rupture of vulnerable plaques can precipitate thromboembolic complications. In this study, we investigate a noncanonical role of proprotein convertase subtilisin/kexin type 9 (PCSK9) beyond its lipid regulatory function, focusing on its impact on vascular smooth muscle cells (VSMCs) in the context of plaque instability. Our results demonstrate that PCSK9 overactivity markedly promotes ferroptotic cell death in VSMCs, thereby exacerbating plaque vulnerability. Furthermore, we delineate the underlying mechanism: PCSK9 physically interacts with Yes-associated protein 1 and targets it for lysosomal degradation, which, in turn, suppresses the expression of nuclear protein 1. In conclusion, our findings unveil a novel role of PCSK9 in promoting plaque instability by driving ferroptosis in VSMCs, suggesting that targeting PCSK9 presents a potential avenue for plaque stabilization, thereby mitigating the incidence of major MACE.


Conflict of interest statement

Competing interests: The authors declare that they have no competing interests.

Figures

Fig. 1.
Fig. 1.
PCSK9 protein levels are associated with increased vulnerability of atherosclerotic plaques in humans. (A) Immunohistochemical staining for PCSK9, CD68, and α-SMA, as well as Masson staining, was performed in stable and vulnerable human plaques. The black continuous line marks the necrotic core area (NC). Scale bars from left to right: 100 and 500 μm. (B to F) Pearson correlations between PCSK9 expression and α-SMA (% area) (B), collagen volume fraction (%) (C), CD68 (% area) (D), necrotic core (% area) (E), and the vulnerability index (F) are presented. The vulnerability index is calculated as [CD68 (% area) + necrotic core (% area)]/[α-SMA (% area) + collagen volume fraction (%)] (n = 26 per group). (G) Immunofluorescent staining for PCSK9 (green) and α-SMA (red) in stable and vulnerable human plaques, with nuclei stained by DAPI (blue) (n = 6). The white arrowheads indicate colocalized cells. Scale bars from left to right: 75 and 20 μm. Statistical analysis was performed by unpaired Student’s t test (G).
Fig. 2.
Fig. 2.
VSMC-specific overexpression of PCSK9 exacerbates plaque vulnerability and VSMC ferroptosis in vivo. (A) Hematoxylin and eosin (H&E) staining showed the plaque lesion area as a percentage of the vascular area (n = 6). Scale bar: 200 μm. (B) Immunohistochemical staining revealed the percentages of macrophages in the lesion area (n = 6). Scale bar: 200 μm. (C) Oil Red O staining (n = 6). Scale bar: 200 μm. (E) Masson staining (n = 6). Scale bar: 200 μm. (D) Immunohistochemical staining revealed the percentages of smooth muscle cells in the lesion area. (F) Vulnerability index of aortic root plaques (n = 6). The solid continuous line denotes the area of the atherosclerotic plaque. (G) Perls’ Prussian blue staining for iron, with black arrowheads indicating positive cells (n = 4). Scale bar: 20 μm. (H) Immunohistochemical staining of 4-HNE (n = 4). Scale bar: 50 μm. (I and J) Immunofluorescent staining for GPX4 and PTGS2 (green) was utilized to evaluate ferroptosis, with α-SMA (red) serving as a reference (n = 4). Nuclei were stained with DAPI (blue). White arrowheads indicate colocalized cells. L, lumen; P, plaque. Scale bar: 75 μm. Statistical analysis was performed by unpaired Student’s t test (A to J).
Fig. 3.
Fig. 3.
PCSK9 enhances ferroptosis in VSMCs in vitro. (A to C) Cell viability (A), glutathione (GSH) levels (B), and malondialdehyde (MDA) levels (C) were assessed in primary mouse VSMCs treated as indicated (n = 4). (D) Living cell FerroOrange staining in primary mouse VSMCs treated as indicated (n = 6). Scale bar: 50 μm. (E) Western blot analysis of the protein levels of PCSK9, PTGS2, and GPX4 in primary mouse VSMCs treated as indicated (n = 6). (F to H) Cell viability (F), GSH levels (G), and MDA levels (H) were measured in primary mouse VSMCs treated with siNC or siPcsk9 for 48 h and oxLDL (50 μg/ml) for 24 h (n = 4). (I) Living cell FerroOrange staining (n = 6). Scale bar: 50 μm. (J) Western blot analysis of the protein levels of PCSK9, PTGS2, and GPX4 in primary mouse VSMCs treated with siNC or siPcsk9 for 48 h and oxLDL (50 μg/ml) for 24 h (n = 6). Statistical analysis was performed by 1-way ANOVA (A to E) or 2-way ANOVA test (F to J).
Fig. 4.
Fig. 4.
PCSK9 induces VSMC ferroptosis by reducing NUPR1 expression. (A) A volcano plot illustrating the differential gene expression analysis between the 2 groups (n = 3). (B) A Venn diagram displaying the overlap between differentially expressed genes (DEGs) and ferroptosis-related genes. (C) A heatmap representing the intersecting genes (n = 3). (D) Quantitative PCR analysis of NUPR1 mRNA levels in primary mouse VSMCs treated as indicated (n = 4). (E) Western blot analysis of the protein levels of PCSK9 and NUPR1 in primary mouse VSMCs treated as indicated (n = 6). (F to H) Measurement of cell viability (F), GSH levels (G), and MDA levels (H) in primary mouse VSMCs treated as indicated (n = 4). (I) Live cell FerroOrange staining in primary mouse VSMCs treated as indicated (n = 6). Scale bar: 50 μm. (J) Western blot analysis of the protein levels of PCSK9, PTGS2, and GPX4 in primary mouse VSMCs treated as indicated (n = 6). Statistical analysis was performed by 1-way ANOVA (D and E) or 2-way ANOVA test (F to J).
Fig. 5.
Fig. 5.
PCSK9 promotes lysosome-mediated degradation of YAP1, down-regulating NUPR1 expression in VSMCs. (A) qPCR analysis of YAP1 and NUPR1 mRNA levels in primary mouse VSMCs treated as indicated (n = 6). (B) Western blot analysis of YAP1 and NUPR1 protein levels in primary mouse VSMCs treated as indicated (n = 6). (C) Western blot analysis of YAP1 protein levels in primary mouse VSMCs treated as indicated (n = 5). (D) qPCR analysis of YAP1 mRNA levels in primary mouse VSMCs treated as indicated (n = 4). (E) Western blot analysis of YAP1 and NUPR1 protein levels in primary mouse VSMCs treated as indicated (n = 4). (F) Visualization of the PCSK9 protein as a dark blue model and the YAP1 protein as a cyan model in PyMOL, with their binding points represented as corresponding colored stick structures. (G) Co-immunoprecipitation of PCSK9 and YAP1 in primary mouse VSMCs. (H) Western blot analysis of YAP1 protein levels in primary mouse VSMCs treated with Ad-GFP or Ad-Pcsk9 and BafA1 (100 nM) for 6 h or treated with CQ (25 μM) for 6 h (n = 6). Statistical analysis was performed by 1-way ANOVA (A to D) or 2-way ANOVA test (E and H).
Fig. 6.
Fig. 6.
Cadd4 ubiquitinates and degrades PCSK9, inhibiting oxLDL-induced ferroptosis. Computer-aided drug design (CADD) techniques were applied to design PCSK9-targeted peptides, named Cadd4. (A) Cell viability in primary mouse VSMCs treated with Cadd4 at different concentration points (n = 8). (B) Fluorescent imaging showing the amount of Cadd4 entering VSMCs over time (red). (C) Western blot analysis of PCSK9 protein levels in primary mouse VSMCs treated with Cadd4 (8 μM) for 8 h (n = 6). (D) Western blot analysis of PCSK9 protein levels in primary mouse VSMCs treated with Cadd4 (8 μM) for 8 h and MG132 (5 μM) for 6 h (n = 6). (E and F) Measurement of GSH levels (E) and MDA levels (F) in primary mouse VSMCs treated with oxLDL (50 μg/ml) for 24 h and Cadd4 (8 μM) for 8 h (n = 4). (G) Live cell FerroOrange staining in primary mouse VSMCs treated with oxLDL (50 μg/ml) for 24 h and Cadd4 (8 μM) for 8 h (n = 4). Scale bar: 50 μm. (H) Western blot analysis of PTGS2 and GPX4 protein levels in primary mouse VSMCs treated with oxLDL (50 μg/ml) for 24 h and Cadd4 (8 μM) for 8 h (n = 6). Data are presented as mean ± SD. Statistical analysis was performed by Kruskal-Wallis test (A), 1-way ANOVA (C), or 2-way ANOVA test (D to G).
Fig. 7.
Fig. 7.
Degradation of PCSK9 via PROTAC restrains intraplaque VSMCs ferroptosis and increases plaque stability. (A) Immunohistochemical staining of 4-HNE (n = 5), unpaired t test. Scale bar: 200 μm. (B and C) Immunofluorescent staining of GPX4 and PTGS2 (green) alongside α-SMA (red) in mouse plaques, with nuclei stained by DAPI (blue) (n = 5 to 6). Scale bar: 150 μm. (D) Hematoxylin and eosin (H&E) staining of plaque lesion area expressed as a percentage of the vascular area (n = 8). Scale bar: 200 μm. (E) Immunohistochemical staining quantifying macrophages as percentages of the lesion area (n = 8). Scale bar: 200 μm. (F) Oil Red O staining of the necrotic core expressed as a percentage of the lesion area (n = 8). Scale bar: 200 μm. (G) Immunohistochemical staining quantifying smooth muscle cells as percentages of the lesion area (n = 8). Scale bar: 200 μm. (H) Masson staining for collagen content, expressed as a percentage of the lesion area (n = 8 mice). Scale bar: 200 μm. (I) Vulnerability index in aortic root plaques (n = 8). The solid continuous line denotes the area of the atherosclerotic plaque. Statistical analysis was performed by unpaired Student’s t test (A to I).

References

    1. Mensah GA, Fuster V, Murray CJL, Roth GA, Global Burden of Cardiovascular Diseases Risks Collaborators . Global burden of cardiovascular diseases and risks, 1990-2022. J Am Coll Cardiol. 2023;82(25):2350–2473. - PMC - PubMed
    1. Stone PH, Libby P, Boden WE. Fundamental pathobiology of coronary atherosclerosis and clinical implications for chronic ischemic heart disease management-the plaque hypothesis: A narrative review. JAMA Cardiol. 2023;8(2):192–201. - PMC - PubMed
    1. Li Q, Fu J, Park K, Shah H, Li Q, Wu IH, King GL. Insulin receptors in vascular smooth muscle cells regulate plaque stability of atherosclerosis. Cardiovasc Res. 2024;120(16):2017–2030. - PMC - PubMed
    1. Grootaert MOJ, Bennett MR. Vascular smooth muscle cells in atherosclerosis: Time for a re-assessment. Cardiovasc Res. 2021;117(11):2326–2339. - PMC - PubMed
    1. Shankman LS, Gomez D, Cherepanova OA, Salmon M, Alencar GF, Haskins RM, Swiatlowska P, Newman AA, Greene ES, Straub AC, et al. KLF4-dependent phenotypic modulation of smooth muscle cells has a key role in atherosclerotic plaque pathogenesis. Nat Med. 2015;21(6):628–637. - PMC - PubMed

LinkOut - more resources