. 2025 Oct 3:3:IMAG.a.159.
doi: 10.1162/IMAG.a.159. eCollection 2025.

Mapping hand function with simultaneous brain-spinal cord functional MRI

Affiliations

Mapping hand function with simultaneous brain-spinal cord functional MRI

Valeria Oliva et al. Imaging Neurosci (Camb). .

Abstract

Hand motor control depends on intricate brain-spinal cord interactions that regulate muscle activity. Hand function can be disrupted by injury to the brain, spinal cord, and peripheral nerves leading to weakness and impaired coordination. Functional MRI (fMRI) can map motor-related neural activity and potentially characterize the mechanisms underlying hand weakness and diminished coordination. Although brain motor control has been extensively studied, spinal cord mechanisms remain less explored. Here we use simultaneous brain-spinal cord fMRI to map neural activity related to hand strength and dexterity across the central nervous system using force matching and finger tapping tasks. We performed simultaneous brain-spinal cord fMRI in 28 right-handed healthy volunteers (age: 40.0 ± 13.8 years, 14 females, 14 males) using a 3T GE scanner. Participants performed a force-matching task at 10%, 20%, and 30% of maximum voluntary contraction. For the finger tapping task, participants completed button presses for three task levels: single-digit response with the second digit only, single-digit response with all digits in a sequential order, and single-digit response with all digits in a random order. Brain and spinal cord images were processed separately and assessed both activations and deactivations. Region of interest (ROI) analyses were also conducted to explore localized changes in activation across the task levels. Both tasks elicited activation in motor and sensory regions of the brain and spinal cord, with graded responses in the left primary motor (M1), left primary sensory (S1) cortex, and right spinal cord gray matter across task levels. Deactivation of the right M1 and S1 was also present for both tasks. Deactivation of the left spinal cord gray matter that scaled with task level was seen in the force matching task. The ROI analysis findings complemented the group level activity maps. Our study provides a detailed map of brain-spinal cord interactions in hand function, revealing graded neural activation and deactivation patterns across motor and sensory regions. Right M1 deactivation is likely evidence of interhemispheric inhibition that restricts extraneous motor output during unilateral tasks. For force matching, the deactivation of the left ventral and dorsal horns of the spinal cord provides the first evidence that the inhibition of motor areas during a unilateral motor task extends to the spinal cord. Whether this inhibition results from direct descending modulation from the brain or interneuronal inhibition in the spinal cord remains to be interrogated. These findings expand our understanding of central motor control mechanisms and could inform rehabilitation strategies for individuals with motor impairments. This approach may offer a foundation for studying motor dysfunction in conditions such as stroke, spinal cord injury, and neurodegenerative diseases.

Keywords: brain; functional MRI; hand strength; motor activity; musculoskeletal and neural physiological phenomena; spinal cord.


Conflict of interest statement

The authors declare no competing interests.

Figures

Fig. 1.
Fig. 1.
Visual cues for the force matching and finger tapping tasks. For the force matching task, participants continuously gripped an MRI-compatible dynamometer with their right hand to match 10%, 20%, and 30% of their maximum voluntary contraction, corresponding to low, medium, and high task levels, respectively. Visual cues were provided with a vertical white bar and a white square bracket that spanned the target force ±1 kgf. The white bar turned green when the force applied to the dynamometer was within the square bracket. For the finger tapping task, participants responded by pressing buttons on an MRI-compatible five button response pad with their right hand. Visual cues were provided by placing a white circle at the distal aspect of the digits of a white hand, indicating when and which button to press. The circles appeared at a rate of 1 Hz, remained visible for 900 ms, and turned green if the correct button was pressed. The experiment had three task levels: a single-digit response with the second digit only, a single-digit response with all digits in a sequential order, and a single-digit response with all digits in a random order, corresponding to low, medium, and high task levels, respectively.
Fig. 2.
Fig. 2.
Group level brain activity for the force matching task across the three task levels: low, medium, and high. Activations (i.e., positive signal change) are shown in red–yellow and deactivations are shown in blue–light blue (i.e., negative signal change). A linear contrast across the task levels was applied to map where the signal linearly increases and decreases across the task levels. The number of active voxels and the average Z score of the active voxels are shown to summarize the spatial extent and magnitude of the activity across the three task levels. The activation maps were generated from a mixed effects analysis at the group level and were voxel-wise thresholded at a Z score >3.10 with a family-wise error (FWE) cluster correction threshold of p < 0.05. The background image is the MNI152 T1-weighted brain template. A = anterior, P = posterior, L = left, R = right.
Fig. 3.
Fig. 3.
Group level spinal cord activity for the force matching task across the three task levels: low, medium, and high. Activations (i.e., positive signal change) are shown in red–yellow and deactivations are shown in blue–light blue (negative signal change). A linear contrast across the task levels was applied to map where the signal linearly increases and decreases across the task levels. The location of the activations and deactivations was assessed using the left–right (LR) index and gray matter–white matter (GW) ratio (--- = no activity, unable to calculate). The number of active voxels and the average Z score of the active voxels are shown to summarize the spatial extent and magnitude of the activity across the three task levels. The activation maps were generated from a fixed effects analysis at the group level and were voxel-wise thresholded at a Z score >2.30 with a family-wise error (FWE) cluster correction threshold of p < 0.05. The background image is the PAM50 T2*-weighted spinal cord template. Every fifth axial slice from the intersection of the subject level functional images is shown. A = anterior, P = posterior, L = left, R = right.
Fig. 4.
Fig. 4.
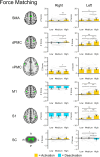
Brain and spinal cord (SC) region of interest (ROI) analysis for the force matching task across the three task levels: low, medium, and high. For the brain ROIs, spheres (radius = 5 mm) were placed at the supplementary motor area (SMA), dorsal premotor cortex (dPMC), ventral premotor cortex (vPMC), primary motor cortex (M1), and primary somatosensory cortex (S1). The spinal cord ROIs included the left or right gray matter spanning the C5 to C6 spinal cord segment levels. The brain and spinal cord regions are shown in green overlaid the respective template. The average Z score within each ROI was extracted. Bar plots show the average activation (yellow) or deactivation (blue) within each region across the subjects. Gray lines show subject level activity level across the task levels. Error bars ± 1 SE. •p < 0.10, *p < 0.05, **p < 0.01, and ***p < 0.001.
Fig. 5.
Fig. 5.
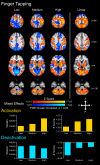
Group level brain activity for the finger tapping task across the three task levels: low, medium, and high. Activations (i.e., positive signal change) are shown in red–yellow and deactivations are shown in blue–light blue (i.e., negative signal change). A linear contrast across the task levels was applied to map where the signal linearly increases and decreases across the task levels. The number of active voxels and the average Z score of the active voxels are shown to summarize the spatial extent and magnitude of the activity across the three task levels. The activation maps were generated from a mixed effects analysis at the group level and were voxel-wise thresholded at a Z score > 3.10 with a family-wise error (FWE) cluster correction threshold of p < 0.05. The background image is the MNI152 T1-weighted brain template. A = anterior, P = posterior, L = left, R = right.
Fig. 6.
Fig. 6.
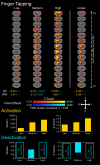
Group level spinal cord activity for the finger tapping task across the three task levels: low, medium, and high. Activations (i.e., positive signal change) are shown in red–yellow and deactivations are shown in blue–light blue (negative signal change). A linear contrast across the task levels was applied to map where the signal linearly increases and decreases across the task levels. The location of the activations and deactivations was assessed using the left–right (LR) index and gray matter–white matter (GW) ratio (--- = no activity, unable to calculate). The number of active voxels and the average Z score of the active voxels are shown to summarize the spatial extent and magnitude of the activations and deactivations across the three task levels. The activation maps were generated from a fixed effects analysis at the group level and were voxel-wise thresholded at a Z score >2.30 with a family-wise error (FWE) cluster correction threshold of p < 0.05. The background image is the PAM50 T2*-weighted spinal cord template. Every fifth axial slice from the intersection of the subject level functional images is shown. A = anterior, P = posterior, L = left, R = right.
Fig. 7.
Fig. 7.
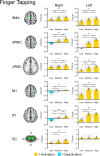
Brain and spinal cord (SC) region of interest (ROI) analysis for the finger tapping task across the three task levels: low, medium, and high. For the brain ROIs, spheres (radius = 5 mm) were placed at the supplementary motor area (SMA), dorsal premotor cortex (dPMC), ventral premotor cortex (vPMC), primary motor cortex (M1), and primary somatosensory cortex (S1). The spinal cord ROIs included the left or right gray matter spanning the C5 to C6 spinal cord segment levels. The brain and spinal cord regions are shown in green overlaid the respective template. The average Z score within each ROI was extracted. Bar plots show the average activation (yellow) or deactivation (blue) within each region across the subjects. Gray lines show subject level activity level across the task levels. Error bars ± 1 SE. •p < 0.10, *p < 0.05, **p < 0.01, and ***p < 0.001.

Update of

References

    1. Andersson, J. L. R., Jenkinson, M., & Smith, S. (2007). Non-linear registration aka Spatial normalisation FMRIB Technial Report TR07JA2. Retrieved July 26, 2024, from https://www.fmrib.ox.ac.uk/datasets/techrep/tr07ja2/tr07ja2.pdf
    1. Avants, B. B., Tustison, N. J., Wu, J., Cook, P. A., & Gee, J. C. (2011). An open source multivariate framework for n-tissue segmentation with evaluation on public data. Neuroinformatics, 9(4), 381–400. 10.1007/s12021-011-9109-y - DOI - PMC - PubMed
    1. Barut, C., Kızıltan, E., Gelir, E., & Köktürk, F. (2013). Advanced analysis of finger-tapping performance: A preliminary study. Balkan Medical Journal, 30(2), 167–171. 10.5152/balkanmedj.2012.105 - DOI - PMC - PubMed
    1. Beaton, D. E., Wright, J. G., Katz, J. N., & Group Upper Extremity Collaborative. (2005). Development of the QuickDASH: Comparison of three item-reduction approaches. The Journal of Bone and Joint Surgery. American Volume, 87(5), 1038–1046. 10.2106/00004623-200505000-00015 - DOI - PubMed
    1. Bédard, S., Karthik, E. N., Tsagkas, C., Pravatà, E., Granziera, C., Smith, A., Weber, K. A., II, & Cohen-Adad, J. (2025). Towards contrast-agnostic soft segmentation of the spinal cord. Medical Image Analysis, 101, 103473. 10.1016/j.media.2025.103473 - DOI - PubMed

LinkOut - more resources