. 2025 Oct 7;7(4):zcaf037.
doi: 10.1093/narcan/zcaf037. eCollection 2025 Dec.

Co-expression of CD30 and SLFN11 serves as a dual biomarker for the treatment of cutaneous T-cell lymphoma

Affiliations

Co-expression of CD30 and SLFN11 serves as a dual biomarker for the treatment of cutaneous T-cell lymphoma

Takatoshi Shimauchi et al. NAR Cancer. .

Abstract

Advanced-stage cutaneous T-cell lymphoma (CTCL) is treated with diverse modalities, including DNA-damaging agents, anti-CD30 antibody-drug conjugates, and histone deacetylase (HDAC) inhibitors. Schlafen 11 (SLFN11) has emerged as a key determinant of sensitivity to DNA-damaging agents, yet its role in CTCL remains unclear. Here, we examined SLFN11 expression in two major CTCL subtypes-mycosis fungoides (MF) and Sézary syndrome (SS). Immunohistochemistry revealed SLFN11 positivity in 52% of MF (13/25) and 80% of SS (4/5) cases, with multivariate analysis showing a significant correlation between SLFN11 and CD30 expression. In normal human peripheral blood mononuclear cells, CD3/CD28/IL-2 stimulation induced co-expression of SLFN11 and CD30 in T cells, which was accompanied by heightened sensitivity to DNA-damaging agents. The JAK inhibitor cerdulatinib suppressed both markers. Among five CTCL cell lines, HUT78-expressing the highest SLFN11 levels-was the most sensitive to DNA-damaging agents, whereas SLFN11 knockout conferred resistance. Attempts to restore SLFN11 expression in SLFN11-low CTCL cells using six (pre)clinical HDAC inhibitors produced inconsistent results across cell lines and drugs. Together, these findings identify SLFN11 and CD30 as co-expressed therapeutic targets in CTCL and support the rationale for CD30-directed antibody-DNA-damaging agent conjugates as a precision treatment strategy.


Conflict of interest statement

None declared.

Figures

Graphical Abstract
Graphical Abstract
Figure 1.
Figure 1.
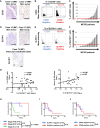
SLFN11 expression in MF/SS and its impact on clinical outcome. (A) Representative images of immunohistochemical staining for CD30 in skin-infiltrating MF tumor cells (original magnification, scale bar indicating 100 μm). (B) Quantification of CD30-positive population (%) in MF/SS tumors using an image analysis software (StrataQuest 7). Representative CD30-negative and -positive results are shown. (C) Distribution of CD30-positive population (%) in all cases of MF/SS. A red line indicates a cut-off value at 5%. (D) Representative images of immunohistochemical staining for SLFN11 in skin-infiltrating MF tumor cells (top). Vascular endothelial cells in the same sample from Case 13 are positive for SLFN11 (bottom, arrow; original magnification, scale bar indicating 100 μm). (E) Quantification of SLFN11-positive population (%) in MF/SS tumors using an image analysis software (StrataQuest 7). Representative SLFN11-negative and -positive results are shown. (F) Distribution of SLFN11-positive population (%) in all cases of MF/SS. A red line indicates a cut-off value at 10%. (G) Correlation analysis between % of SLFN11-positive (SLFN11+) cells and % of CD30-positive (CD30+) cells (right) or % of SLFN11+ cells and serum values of sIL-2R (left). Each dot represents one patient. The correlation coefficient (r) was calculated using the Pearson correlation coefficient test. (H) Kaplan–Meier curves for OS rate (%) in all the enrolled MF/SS patients (25 in MF and 5 in SS patients). For stage IA–IB versus IV, hazard ratio (HR), 0.1183; 95% confidence interval (CI), 0.02969–0.4714; P= .0027 (log-rank test). For stage IIB–III versus IV, HR, 0.1041; 95% CI, 0.02491–0.4350; P= .0046. For stage IA–IB versus IIB–III, HR, 5.755; 95% CI, 0.1096–302.1; P= .3865. (I) Kaplan–Meier curves for OS rate (%) in 13 MF/SS patients with stage IV group (8 in SLFN11-positive group and 5 in SLFN11-negative group), HR, 0.7759; 95% CI, 0.1665–3.614; P= .3823. (J) Kaplan–Meier curves for OS rate (%) in 13 MF/SS patients with stage IV group (9 in CD30-positive group and 4 in CD30-negative group), HR, 0.7263; 95% CI, 0.1542–3.422; P= .8591. N.S., not significant.
Figure 2.
Figure 2.
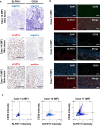
Co-expression of SLFN11 and CD30 in MF tumor cells. (A) Representative images of immunohistochemical staining for SLFN11 and CD30 in skin-infiltrating MF tumor cells (original magnification, scale bar indicating 100 μm). (B) Representative images of immunofluorescence staining for SLFN11 (red), CD30 (green), and DAPI (blue) corresponding to Fig. 2A (original magnification, scale bar indicating 100 μm). (C) An image cytometry analysis by StrataQuest 7 shows the intensity of SLFN11 and CD30 in each cell.
Figure 3.
Figure 3.
Activation via T-cell receptor/IL-2R induces the functional SLFN11 expression in normal T cells. (A) Immunoblotting showing SLFN11, CD30, and CD3 expressions in PBMCs with or without IFN-γ or CD3/CD28/IL-2 stimulation for 5 days. Actin was used as a loading control. (B) Representative confocal microscopy images for SLFN11 (green), CD3 (red), and DAPI (blue) (top panel) or SLFN11 (green), CD30 (red), and DAPI (blue) (bottom panel) in PBMCs 7 days after each activation (original magnification, scale bar indicating 10 μm). (C) Viability curves to various concentrations of TOP1 inhibitor CPT in PBMCs with or without CD3/CD28/IL-2 stimulation for 5–7 days. Viability was examined by ATP assay 48 h after the CPT treatments. Representative results in triplicate from two independent experiments are shown as mean ± SD.
Figure 4.
Figure 4.
SLFN11 expression determines sensitivity to DNA-targeting agents, TOP1 and TOP2 inhibitors in CTCL cell lines. (A) Immunoblotting showing SLFN11 expression in the indicated CTCL cell lines. Actin was used as a loading control. (B) Viability curves of the indicated CTCL cell lines to various concentrations of TOP1 inhibitor (CPT) or TOP2 inhibitor (ETP). (C) Immunoblotting showing SLFN11 expression in the HUT78 parental and SLFN11 knockout (SLFN11-KO#A and #B) cells. GAPDH was used as a loading control. (D) Viability curves of the HUT78 parental and SLFN11 KO cells to CPT and ETP. (B, D) Viability was examined by ATP assay 72 h after the drug treatments. Representative results in triplicate from two or three independent experiments are shown as mean ± SD. ***P< .001 by one-way ANOVA followed by Dunnett’s multiple-comparisons test.
Figure 5.
Figure 5.
JAK pathway activation and epigenetic suppression regulate SLFN11 expression in CTCL cell lines. (A) Immunoblotting showing SLFN11 and CD30 expressions in HUT78 cells treated with pan-JAK inhibitor, cerdulatinib (40 μM), for the indicated time. Actin was used as a loading control. A representative result of two independent experiments is shown. (B) Immunoblotting showing SLFN11 expression in MJ cells treated with the indicated HDAC inhibitors (10 μM each) for 16 h. GAPDH was used as a loading control. The relative ratio of SLFN11/GAPDH in each HDAC inhibitor-treated MJ cell is indicated at the bottom. A representative result of three independent experiments is shown. (C) Viability curves of the MJ cells to the indicated HDAC inhibitors. Viability was examined by ATP assay 72 h after the drug treatments. Representative results in triplicate from two independent experiments are shown as mean ± SD.

References

    1. Board TWCoTE WHO Classification of Tumours. 2024; 5th ednLyon: IARC Press.
    1. Fujii K, Hamada T, Shimauchi T et al. Cutaneous lymphoma in Japan, 2012–2017: a nationwide study. J Dermatol Sci. 2020; 97:187–93. 10.1016/j.jdermsci.2020.01.010. - DOI - PubMed
    1. Olsen EA, Whittaker S, Willemze R et al. Primary cutaneous lymphoma: recommendations for clinical trial design and staging update from the ISCL, USCLC, and EORTC. Blood. 2022; 140:419–37. 10.1182/blood.2021012057. - DOI - PMC - PubMed
    1. Agar NS, Wedgeworth E, Crichton S et al. Survival outcomes and prognostic factors in mycosis fungoides/Sezary syndrome: validation of the revised International Society for Cutaneous Lymphomas/European Organisation for Research and Treatment of Cancer staging proposal. J Clin Oncol. 2010; 28:4730–9. 10.1200/JCO.2009.27.7665. - DOI - PubMed
    1. Talpur R, Singh L, Daulat S et al. Long-term outcomes of 1,263 patients with mycosis fungoides and Sezary syndrome from 1982 to 2009. Clin Cancer Res. 2012; 18:5051–60. 10.1158/1078-0432.CCR-12-0604. - DOI - PMC - PubMed

MeSH terms