. 2025 Jan-Dec:16:21501319251375393.
doi: 10.1177/21501319251375393. Epub 2025 Oct 9.

Impact of a Multi-Factorial Primary Care Intervention on Opioid Use Disorder Treatment and Overdose Outcomes

Affiliations

Impact of a Multi-Factorial Primary Care Intervention on Opioid Use Disorder Treatment and Overdose Outcomes

Anna R Morgan-Barsamian et al. J Prim Care Community Health. 2025 Jan-Dec.

Abstract

Objectives: The PINPOINT (PaIn aNd oPiOId maNagemenT) intervention in Oregon aimed to support primary care clinics in applying evidence-based guidelines for pain management and opioid use disorder treatment. We evaluated the impact of this intervention on opioid use disorder treatment and overdose outcomes.

Methods: Data from the voluntary Oregon All Payer All Claims datasets were integrated with several administrative datasets to create the Provider Results of Opioid Management and Prescribing Training dataset, which tracks clinical and prescribing activities at the provider level. We employed difference-in-differences models to assess the impact of PaIn aNd oPiOId maNagemenT enrollment on changes in opioid use disorder treatment and overdose outcomes. The intervention sample consisted of 289 primary care providers from clinics participating in PaIn aNd oPiOId maNagemenT, compared with 2000 control providers identified through administrative claims.

Results: The difference-in-differences models indicated statistically significant associations between intervention enrollment and treatment with medications for opioid use disorder (incidence rate ratio [IRR] = 1.214, 95% confidence interval [CI] = 1.100-1.340), any substance use disorder treatment (IRR = 1.120, 95% CI = 1.070-1.172), and any outpatient opioid use disorder treatment (IRR = 1.102, 95% CI = 1.034-1.175) compared to controls. No statistically significant changes were observed in overall non-fatal drug overdoses, non-fatal opioid overdoses, and naloxone overdose reversals, though absolute event rates were low.

Conclusions: We found that multi-faceted, evidence-based approaches to improve clinical practice in primary care settings were associated with increased treatment for opioid use disorder, however differences in overdose outcomes were not observed. Further research is needed to assess the scalability and clinical impact of these interventions across diverse care environments.

Keywords: medications for opioid use disorder; overdose outcomes; primary care; state-level intervention; substance use disorder treatment.


Conflict of interest statement

Declaration of Conflicting InterestsThe authors declared no potential conflicts of interest with respect to the research, authorship, and/or publication of this article.

Figures

Visualize a five-step process depicted in a flowchart format, with various boxes and arrows indicating the flow
Figure 1.
PROMPT linkage methodology. Abbreviations: APCD, All Payer All Claims dataset; DEA, Drug Enforcement Agency; DOB, date of birth; EMS, Emergency Medical Services; HDD, Hospital Discharge Data; IVPP, Injury and Violence Prevention Program; MOTS, Measures and Outcomes Tracking System; NPI, National Provider Identifier; PCP, primary care provider; PDMP, Prescription Drug Monitoring Program. Step 1a: Identification of both the provider and patient study cohorts, including providers at PINPOINT clinics, eligible control providers, and all patients in the APCD attributed to a provider in the study cohort during any quarter of the study period. Step 1b: Patient-level linkage of EMS, MOTS, and Vital Records data to the APCD to create an Enhanced APCD. The linkage analyst uses a probabilistic linkage algorithm matching patients by first name, last name, birth date, and sex. Step 2: Addition of HDD data to the Enhanced APCD. Linkage is conducted jointly by the OHA analyst and the linkage analyst, with the OHA analyst retaining custody of HDD patient identifiers. Step 3: Transformation of the Enhanced APCD into a dataset with monthly time-varying provider panel metrics and clinic-level information. The dataset is linked to PINPOINT implementation data to create the PCP-level Enhanced APCD w/PINPOINT Data file. Step 4: The IVPP replaces Provider NPIs in the dataset with masked provider identifiers and identifies PDMP fills for all providers in the cohort. The PDMP dataset is linked to masked identifiers, and all source datasets held by the linkage analyst are destroyed to prevent relinkage. Step 5: Final de-identification of tables in the PROMPT database. The IVPP and linkage analysts destroy all patient, provider, and pharmacist identifiers, ensuring only masked identifiers remain. The final files delivered to the study team include the PROMPT Patient-to-Provider Attribution Table, the PROMPT PDMP Table, and the PROMPT Provider-level Table, containing aggregated information from source datasets.
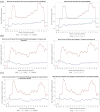
The image, composed of six line graphs, illustrates the monthly clinical outcomes of intervention and control providers, focusing on the percentage of patients per provider per month for three different outcomes: MOUD treatment, any substance use treatment, and outpatient opioid treatment. The x-axis represents the time in months from the beginning of the study, with negative values indicating months before the intervention and positive values indicating the duration of the intervention.
Figure 2.
Monthly clinical outcome levels for intervention and control providers, expressed as mean percentage of patients per provider panel with each outcome. Months are expressed relative to start of intervention, or corresponding control time period. (a) MOUD treatment, (b) any substance use treatment, and (c) any outpatient opioid treatment. Blue line represents the control group. Red line represents the intervention group. Time is measured in months from the PINPOINT intervention. The mean unit is the percentage of a provider’s panel with the outcome of interest identified in each panel.

References

    1. Militello LG, Hurley RW, Cook RL, et al. Primary care clinicians’ beliefs and strategies for managing chronic pain in an era of a national opioid epidemic. J Gen Intern Med. 2020;35(12):3542-3548. - PMC - PubMed
    1. Lagisetty PA, Healy N, Garpestad C, Jannausch M, Tipirneni R, Bohnert ASB. Access to primary care clinics for patients with chronic pain receiving opioids. JAMA Netw Open. 2019;2(7):e196928. - PMC - PubMed
    1. Bao Y, Pan Y, Taylor A, et al. Prescription drug monitoring programs are associated with sustained reductions in opioid prescribing by physicians. Health Aff. 2016;35(6):1045-1051. - PMC - PubMed
    1. Hutchinson E, Catlin M, Andrilla CH, Baldwin LM, Rosenblatt RA. Barriers to primary care physicians prescribing buprenorphine. Ann Fam Med. 2014;12(2):128-133. - PMC - PubMed
    1. Foti K, Heyward J, Tajanlangit M, et al. Primary care physicians’ preparedness to treat opioid use disorder in the United States: a cross-sectional survey. Drug Alcohol Depend. 2021;225:108811. - PMC - PubMed

MeSH terms

LinkOut - more resources