. 2025 Oct;21(10):e70640.
doi: 10.1002/alz.70640.

Intestinal inflammation induces glymphatic remodeling, priming early neurodegenerative signals in male mice

Affiliations

Intestinal inflammation induces glymphatic remodeling, priming early neurodegenerative signals in male mice

Clara Ciampi et al. Alzheimers Dement. 2025 Oct.

Abstract

Introduction: Inflammatory bowel disease triggers extraintestinal manifestations, including in the central nervous system (CNS). However, the direct impact of peripheral inflammation on the CNS is largely unknown.

Methods: Using a mouse model of colitis with pain and anxiety-like behavior, we investigated the intricate pathogenic link between colonic inflammation, disruptions in circadian rhythmicity and impaired glymphatic circulation.

Results: By in vivo magnetic resonance imaging, we observed a derangement of brain fluid dynamics, with a significant enlargement of the cerebral lateral ventricles and waste deposition within the brain parenchyma. Proteomics revealed changes in cerebrospinal fluid (CSF) composition, enriched in proteins related to inflammation, immune response, complement, neuronal, and lipid metabolic pathways. Alterations in brain metabolite concentrations and in inhibitory control mechanisms and excitatory transmission were detected.

Discussion: Colonic inflammation induces remodeling in CSF volume distribution, clearance, and metabolism, with derangement of the crosstalk between neurons and astrocytes, priming synaptopathy.

Highlights: An acute peripheral inflammatory trigger affects the central level by remodeling central nervous system (CNS) fluid distribution and priming early signals of synaptopathy. A single dextran sulfate sodium (DSS) challenge disrupts the circadian clock machinery and alters CNS fluid distribution, a so far neglected system, thereby impairing glymphatic clearance of waste products and indirectly altering neurotransmitter release dynamics. These combined effects ultimately impact brain function, extending to the regulation of behavior. Understanding how an intestinal inflammatory insult may derange the daily rhythm of the mechanisms controlling brain waste disposal may help identify specific groups of subjects at high risk of developing neurological disorders.

Keywords: aquaporin‐4; brain waste clearance; circadian regulation; dextran sulfate sodium–driven painful colitis; inflammation; neurotransmitter release.


Conflict of interest statement

The authors declare no competing interests. Author disclosures are available in the supporting information.

Figures
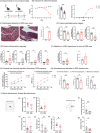
FIGURE 1
FIGURE 1
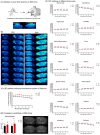
DSS‐induced colitis mouse model. A, Experimental setting for in vivo model of colitis: 2.5% DSS was dissolved in the drinking water and fed ad libitum to male C57BL/6N WT mice at 8 weeks of age for acute setting. B, The percentage of body weight loss was calculated starting from the second DSS treatment until the week of sacrifice. Data are expressed as mean ± SEM and analyzed using a two‐way ANOVA (condition and time were considered variables) with a Bonferroni post hoc test (****P < 0.0001). Colon length was measured after the sacrifice. Data are expressed as mean ± SEM and analyzed using a two‐tailed unpaired Student t test (****P < 0.0001). DAI was scored from day 1 pre exposure to 2 days post exposure. Weight, presence of blood, and gross stool consistency of all mice were determined daily. Data are expressed as mean ± SEM and analyzed using a two‐way ANOVA (condition and time were considered variables) with Bonferroni post hoc test (****P < 0.0001). C–F, Histological and molecular features of colonic tissue. C, Representative photomicrographs of H&E‐stained colon sections of CTR and DSS mice (scale bars represent 100 𝝁m) and histopathology scores. Data are reported as mean ± SD, n = 3/group. D, mRNA expression of the epithelial barrier junctions, Ocln (n = 10/group), Tjp1 (n = 11/group), and Cldn5 (n = 11/group), and (E) pro‐ and anti‐inflammatory cytokines, Il1b (n = 13/group), Tnf (CTR n = 12 and DSS n = 13), Il6 (n = 11/group), and Il10 (n = 13/group) was evaluated in colon tissues from CTR and DSS mice by rt‐PCR. Data are reported as mean ± SEM and analyzed using an unpaired two‐tailed t test (*P < 0.05, **P < 0.01, ***P < 0.001 vs. respective controls). F, mRNA (CTR n = 11 and DSS n = 13) and protein (n = 4/group) expression of Aqp4 in colon tissues. Data are reported as mean ± SEM and analyzed using an unpaired two‐tailed t test (*P < 0.05, **P < 0.01, ***P < 0.001 vs. respective control). G, H, Visceral and somatic pain. G, Visceral sensitivity was assessed by measuring the electromyography (EMG) amplitude of abdominal contraction VMR; (a) and scoring behavioral responses AWR; (b) in awake animals to colorectal distension with increasing volumes (50–200 µL balloon inflation). H, Somatic pain was assessed in mice by the cold plate test (thermal allodynia; (a) hot plate test (thermal hyperalgesia); (b) and the von Frey test (mechanical allodynia); (c) each value represents the mean  ±  SEM of nine animals per group (n  =  9). **P < 0.01 and ****P < 0.0001 versus controls and analyzed using a two‐way ANOVA with Šídák multiple comparisons test. Each value represents the mean  ±  SEM of 10 animals per group (n  =  10). *P < 0.05 and **P < 0.01 versus controls and analyzed using a two‐way ANOVA with Šídák multiple comparisons test. I, Anxiety‐like behavior: (a) distance traveled (in meters) in the open field test from control (CTR, black bar, n = 10) and DSS (red bar, n = 15) mice. Data are expressed as mean ± SEM. Two‐tailed unpaired Student t test, t = 1.979, df = 23, C.I. = −4.449 to 0.09815, η2 = 0.1455, P = 0.06 DSS versus CTR. b, Frequency of grooming behavior (in numbers) in the open field test from control (CTR, black bar, n = 10) and DSS (red bar, n = 15) mice. Data are expressed as mean ± SEM. Two‐tailed unpaired Student t test with Welch correction, t = 1.771, df = 17.36, C.I. = −0.4987 to 5.765, η2 = 0.1530, P = 0.0941 DSS versus CTR. c, Time spent performing grooming behavior (in seconds) in the open field test from control (CTR, black bar, n = 10) and DSS (red bar, n = 15) mice. Data are expressed as mean ± SEM. Two‐tailed unpaired Student t test with Welch correction, t = 2.278, df = 17.95, C.I. = 1.649 to 40.95, η2 = 0.2242, P = 0.0352; *P < 0.05 DSS versus CTR. d, Time spent in the center area (in seconds) of the open field arena from control (CTR, black bar, n = 10) and DSS (red bar, n = 15) mice. Data are expressed as mean ± SEM. Two‐tailed unpaired Student t test with Welch correction, t = 2.503, df = 10.92, C.I. = −17.30 to −1.103, η2 = 0.3645, P = 0.0295; *P < 0.05 DSS versus CTR. e, Numbers of entries in the center area of the open field arena from control (CTR, black bar, n = 10) and DSS (red bar, n = 15) mice. Data are expressed as mean ± SEM. Two‐tailed unpaired Student t test, t = 3.050, df = 23 C.I. = −7.048 to −1.352, η2 = 0.2880, P = 0.0057; **P < 0.01 DSS versus CTR. f, Time spent in the open arms (in seconds) of the elevated plus maze apparatus from control (CTR, black bar, n = 10) and DSS (red bar, n = 11) mice. Mann–Whitney test. Data are expressed as mean ± SEM. P = 0.0072; **P < 0.01 DSS versus CTR. g, Number of poking holes in the hole board task from control (CTR, black bar, n = 10) and DSS (red bar, n = 13) mice. Data are expressed as mean ± SEM. Two‐tailed unpaired Student t test with Welch correction, t = 2.333, df = 9.920, C.I. = −50.08 to −1.123, η2 = 0.3543, P = 0.0420; *P < 0.05 DSS versus CTR. ANOVA, analysis of variance; AWR, abdominal withdrawal reflex; CTR, control; DAI, disease activity index; DSS, dextran sulfate sodium; rt‐PCR, reverse transcription polymerase chain reaction; SD, standard deviation; SEM, standard error of the mean; VMR, viscero‐motor response; WT, wild type
FIGURE 2
FIGURE 2
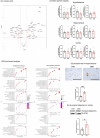
Misalignment of circadian clockwork from periphery to center. A, Scatter plot of the expression (2^‐ΔΔCt) of different clock genes across different time points (hours) in the colon dataset. The color indicates the assignment of the data point to a specific condition. The dashed lines represent the modeled gene expression in each condition across time. The modeling has been performed using the MetaCycle package (n = 3 for each time point). B, Scatter plot of the expression (2^‐ΔΔCt) of different clock genes across different time points (hours) in the hippocampus, hypothalamus, and cortex datasets. The color indicates the assignment of the data point to a specific condition. The dashed lines represent the modeled gene expression in each condition across time. The modeling has been performed using the MetaCycle package. n = 3 for each time point. CTR, control; DSS, dextran sulfate sodium
FIGURE 3
FIGURE 3
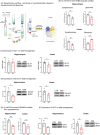
Alteration in brain fluid dynamics in acute DSS‐induced colitis mice. A, Cartoon of the intracisterna magna injection of gadolinium and MRI scan. B, Representative longitudinal 3D T1‐weighted high‐resolution images of gadolinium‐enhanced MRI of the brain before (baseline upper panel) and after intracisternal injection of Gadovist in a CTR (lower left panel) and a DSS‐treated mouse (lower right panel) under ketamine/xylazine general anesthesia. C, The percentage SE (%)—with respect to the baseline as a function of time after the intracisternal (CM) injection of Gadovist in CTR and DSS‐treated animals. A significant general effect on condition was found (P < 0.0001). Group data were gathered every 6 minutes. The manually defined region of interest was the perivascular pathway of the CSF along the brain vessels. Sample size for each time point includes CTR n = 9 for 25′, n = 11 for 31′, 37′, 43′, 49′, 55′, 61′; n = 11 for 67′, 73′; n = 5 for 79′; DSS n = 12 for 25′, 31′; n = 13 for 37′, 43′, 49′, 55′, 61′, 67′; n = 12 for 73′; n = 4 for 79′. Data are expressed as mean ± SEM and analyzed using a two‐way ANOVA with Bonferroni post hoc test. D, The percentage SE (%)—with respect to the baseline as a function of time after the intracisternal (CM) injection of Gadovist in CTR and DSS‐treated animals in brain regions extracted from a predefined mouse atlas. Group data were gathered every 6 minutes. The analyzed regions were: olfactory bulb, hypothalamus, hippocampus, amygdala, basal forebrain septum, cortex, striatum, midbrain, superior and inferior colliculi, brainstem, cerebellum, thalamus, and central gray (CTR n = 9 for 25′, n = 11 for 31′, 37′, 43′, 49′, 55′, 61′, 67′, 73′; n = 5 for 79′; DSS n = 12 for 25′, 31′; n = 13 for 37′, 43′, 49′, 55′, 61′, 67′; n = 12 for 73′; n = 4 for 79′). Significant general effects on condition were found for the olfactory bulb (P = 0.048), striatum (P = 0.020), hippocampus (P = 0.023), basal forebrain septum (P = 0.027), hypothalamus (P = 0.045), amygdala (P = 0.016), and midbrain (P = 0.011). Data are expressed as mean ± SEM and analyzed using a two‐way ANOVA (condition and time post intracisternal Gadovist injection were considered variables, and a mixed effect model was applied for missing values) with Bonferroni post hoc test (*P < 0.05, **P < 0.01, ***P < 0.001 vs. respective control). E, Lateral ventricle volume from CTR and DSS‐treated animals extracted from the last time point after intracisternal (CM) injection of Gadovist (73′ post injection) by manually drawing a VOI of the left and the right lateral ventricles; CTR n = 11, DSS n = 13; Data are expressed in mm^3 as mean ± SEM and analyzed using a two‐way ANOVA (condition and hemisphere were considered variables) with Bonferroni post hoc test (*P < 0.05, **P < 0.01, ***P < 0.001 vs. respective control). ANOVA, analysis of variance; CSF, cerebrospinal fluid; CTR, control; DSS, dextran sulfate sodium; MRI, magnetic resonance imaging; SE, signal enhancement; SEM, standard error of the mean; VOI, volume of interest
FIGURE 4
FIGURE 4
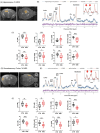
Alteration in brain CSF protein content and aberrant waste product deposition in acute DSS‐induced colitis mice. A, Volcano plot of the proteomic data analysis on CSF from control and DSS mouse model (CTR = 8; DSS = 8). The red dots identify the significant differentially regulated proteins in the dataset (absolute log2FC > 1 and adjusted P value < 0.05). A positive FC indicates more expression in the DSS condition. B, Enrichment analysis results run over the significant proteins (divided by upregulated or downregulated). We reported the top 10 terms per annotation ranked by combined score. On the X axis, we reported the combined score (a metric derived from enrichR); on the Y axis, the name of the term. We divided the plot per annotation. Here, we have reported the results from Gene Ontology Biological Processes, Gene Ontology Cellular Component, KEGG and REACTOME, Gene Ontology Molecular Function, MSigDB hallmark, and Wiki Pathway. C, mRNA expression of the blood–brain barrier junctions Ocln, Tjp1, and Cldn5 was measured in the hypothalamus, hippocampus, and cortex (hypothalamus Ocln and Tjp1 n = 9/group, Cldn5 CTR n = 7 and DSS n = 9; hippocampus Ocln CTR n = 8 and DSS n = 9, Tjp1, and Cldn5 CTR n = 10 and DSS n = 9; cortex Ocln and Tjp1 n = 8/each group and Cldn5 CTR n = 11 and DSS n = 12) by rt‐PCR. Data are reported as mean ± SEM and analyzed using an unpaired two‐tailed t test. D, Phosphorylated tau protein density in hippocampus from control (CTR, black bar) and DSS (red bar) mice. Representative images of phosphorylated tau for the CTR and DSS conditions are reported; magnification 100×; scale bar 100 µm. Immunohistochemistry was performed on brains of both CTR (n = 7) and DSS‐treated mice (n = 7) using anti‐phosphorylated tau. Data are expressed as the mean percentage of phosphorylated tau deposition in brains. Two‐tailed unpaired Student t test. ***P < 0.001 DSS versus CTR. E, Amyloid oligomer protein density in cortical homogenates from control (CTR, black bar) and DSS (red bar) mice. Amyloid oligomers protein density was expressed as the protein/β‐actin ratio and changes in DSS mice were expressed as the O.D. of the protein/β‐actin ratio in CTR mice. The panel shows representative images in homogenates from the cortex of CTR mice (n = 5) and DSS mice (n = 5). Data are expressed as mean ± SEM. Two‐tailed unpaired Student t test, t = 3.922, df = 8, C.I. = −0.7382 to −0.1915, η2 = 0.6578, P = 0.0044, **P < 0.01 DSS versus CTR. CSF, cerebrospinal fluid; CTR, control; DSS, dextran sulfate sodium; FC, fold change; O.D., optical density; rt‐PCR, reverse transcription polymerase chain reaction; SEM, standard error of the mean
FIGURE 5
FIGURE 5
Glial immunoreactivity in acute DSS‐induced colitis mouse brains. A, AQP4 mRNA and protein expression in hippocampal (left) and cortical (right) samples from control (CTR, black bar) and DSS (red bar) mice is shown. AQP4 protein density was expressed as protein/β‐actin ratio and changes in DSS mice were expressed as a percentage of the protein/β‐actin ratio of CTR mice. β‐Actin was used as an internal standard. PCR data are reported as mean ± standard error of the mean and analyzed using an unpaired two‐tailed t test (*P < 0.05 and ****Pp < 0.0001 vs. respective controls). The panel shows representative images of AQP4 immunopositivity of homogenates from CTR mice (hippocampus, n = 8; cortex, n = 8) and DSS mice (hippocampus, n = 9; cortex, n = 7). Two‐tailed unpaired Student t test, *P < 0.05, **P < 0.01, ***P < 0.001, ****P < 0.0001, versus respective control. B, Protein densities of the principal components of the tetra‐partite synapses in DSS mice compared to CTR. Astrocytes: GFAP and vimentin protein immunoblotting (up) and density (down) in hippocampal (left) and cortical (right) homogenates from CTR mice (black bar, GFAP: hippocampus, n = 6; cortex, n = 10; vimentin: hippocampus, n = 8; cortex, n = 7) and DSS mice (red bar, GFAP: hippocampus, n = 6; cortex, n = 10; vimentin: hippocampus, n = 7; cortex, n = 6). Microglia: CD11b and CD45 protein immunoblotting (up) and density (down) in hippocampal (left) and cortical (right) homogenates from CTR mice (black bar, CD11b: hippocampus, n = 6; cortex, n = 10; CD45: hippocampus, n = 8; cortex, n = 6) and DSS mice (red bar, CD11b: hippocampus, n = 5; cortex, n = 11; CD45: hippocampus, n = 8; cortex, n = 5). Pre‐ and post‐synaptic compartments: Synaptophysin and PSD95 protein immunoblotting (up) and density (down) in hippocampal (left) and cortical (right) homogenates from CTR mice (black bar, Synaptophysin: hippocampus, n = 6; cortex, n = 9; PSD95: hippocampus, n = 5; cortex, n = 7) and DSS mice (red bar, Synaptophysin: hippocampus, n = 6; cortex, n = 8; PSD95: hippocampus, n = 5; cortex, n = 10). The density of each protein was expressed as a protein/β‐actin ratio; changes in DSS mice were expressed as a percentage of the protein/β‐actin ratio in CTR mice. β‐Actin was used as an internal standard. The panel shows representative images for each investigation. Two‐tailed unpaired Student t test, *P < 0.05, **P < 0.01, versus respective control. Full gels are available as supporting information (Figure 5_supplementary data WB). AQP4, aquaporin‐4; DSS, dextran sulfate sodium; GFAP, glial fibrillary acidic protein; PCR, polymerase chain reaction; PSD95, postsynaptic density protein 95
FIGURE 6
FIGURE 6
Altered synaptic transmission in acute DSS‐induced colitis mouse brains. A, Cartoon of the (i) technique of isolation of purified nerve endings (synaptosomes) and astrocytic specializations (gliosomes) from hippocampal and cortical tissues and their purification on Percoll gradient and (ii) of the “up–down superfusion technique” to monitor neurotransmitter release. B, Release of preloaded [3H]D‐aspartate evoked by 15 mM KCl from hippocampal synaptosomes (up, left, n = 6), cortical synaptosomes (down, left, n = 5), hippocampal gliosomes (up, right, n = 6), and cortical gliosomes (down, right, n = 5) of control (CTR, black bar) and DSS mice (red bar). The tritium overflow is calculated as [3H]D‐ASP overflow over basal release, and it is expressed as a percentage of total tritium content in both particles. Data are expressed as mean ± SEM of (n) experiments run in triplicate on different days. Two‐tailed unpaired Student t test, *P < 0.05, **P < 0.01, ***P < 0.001 versus respective control. C, GLT‐1 protein density in hippocampal (left) and cortical (right) homogenates from control (CTR, black bar) and DSS (red bar) mice. GLT‐1 protein density was expressed as a protein/β‐actin ratio, and changes in DSS mice were expressed as a percentage of the protein/β‐actin ratio in CTR mice. β‐Actin was used as an internal standard. The panel shows representative images of GLT‐1 immunopositivity of homogenates from CTR mice (hippocampus, n = 6; cortex, n = 6) and DSS mice (hippocampus, n = 6; cortex, n = 5). Two‐tailed unpaired Student t test, *P < 0.05, versus respective control. D, GLAST protein density in hippocampal (left) and cortical (right) homogenates from control (CTR, black bar) and DSS (red bar) mice. GLAST protein density was expressed as a protein/β‐actin ratio, and changes in DSS mice were expressed as a percentage of the protein/β‐actin ratio in CTR mice. β‐Actin was used as an internal standard. The panel shows representative images of GLAST immunopositivity of homogenates from CTR mice (hippocampus, n = 5; cortex, n = 6) and DSS mice (hippocampus, n = 5; cortex, n = 5). Two‐tailed unpaired Student t test, *P < 0.05, versus respective control. E, Release of preloaded [3H]‐GABA evoked by 15 mM KCl from hippocampal synaptosomes (left, n = 5) and cortical synaptosomes (right, n = 5) of control (CTR, black bar) and DSS mice (red bar). The tritium overflow is calculated as [3H]‐GABA overflow over basal release, and it is expressed as a percentage of total tritium content. Data are expressed as mean ± SEM of (n) experiments run in triplicate in different days. Two‐tailed unpaired Student t test, **P < 0.01, ***P < 0.001 versus respective control. F, GAT1 protein density in hippocampal (left) and cortical (right) homogenates from control (CTR, black bar) and DSS (red bar) mice. GAT1 protein density was expressed as a protein/β‐actin ratio, and changes in DSS mice were expressed as percentage of the protein/β‐actin ratio in CTR mice. β‐Actin was used as an internal standard. The panel shows representative images of GAT1 immunopositivity of homogenates from CTR mice (hippocampus, n = 6; cortex, n = 7) and DSS mice (hippocampus, n = 5; cortex, n = 5). Two‐tailed unpaired Student t test, *P < 0.05, **P < 0.01 versus respective control. Western blot analyses were performed on distinct samples on different days (number of samples = n as indicated). Full gels are available as supporting information (Figure 6_supplementary data WB). CTR, control; DSS, dextran sulfate sodium; GAT1, GABA transporter type 1; GLAST, glutamate aspartate transporter; GLT‐1, glutamate transporter 1; SEM, standard error of the mean
FIGURE 7
FIGURE 7
In vivo 1H MRS in CTR and DSS‐treated mice. A and D, Voxel location in the left hippocampus and in the left somatosensory cortex respectively, depicted over T2 RARE axial and coronal images of the brain. B and E, Representative spectra of average quality (light blue line) in the left hippocampus and left somatosensory cortex, respectively, fitted by LCModel (orange line). The spline baseline (yellow line) and the residuals (purple line) are also depicted. For each graph the inset is a zoom of two representative spectra, one CTR (black line) and one DSS (red line), in the region of major spectrum alterations (total choline and taurine) between 2.9 and 3.5 ppm. C and F, Boxplots of the concentrations of the metabolites of interest in mmol/L in CTR (black) and DSS (red) mice in the left hippocampus and left somatosensory cortex, respectively. The boxes range from the 25% and the 75% percentiles; the 5% and 95% percentiles are indicated as error bars; single data points are depicted as full circles. Medians are represented by horizontal lines within each box. In Panel 6C for Cr, PCr, Cr+PCr, GPC+PCh, Glu, Glu+Gln, Tau, and Glyc n = 14 CTR and n = 17 DSS‐treated mice were considered. In Panel 6F for Cr, PCr, Cr+PCr, GPC+PCh, Glu, Glu+Gln, Tau, and Glyc n = 16 CTR and n = 14 DSS‐treated mice, and for Cr N = 16 CTR and N = 13 DSS‐treated mice were considered. Statistical significance was retrieved from an unpaired Student t test (two‐tailed) and indicated with the asterisks (*P < 0.05, **P < 0.01, ***P < 0.001, ****P < 0.0001 vs. control). Cr, creatine; CTR, control; DSS, dextran sulfate sodium; Gln, glutamate + glutamine; Glu, glutamate; Glyc, glycine; GPC, glycophosphorylcholine; PCh, phosphorylcholine; PCr, phosphocreatine; Tau, taurine

References

    1. Massironi S, Pigoni A, Vegni EAM, et al. The burden of psychiatric manifestations in inflammatory bowel diseases: a systematic review with meta‐analysis. Inflamm Bowel Dis. 2025;31(5):1441‐1459. doi: 10.1093/ibd/izae206 - DOI - PubMed
    1. Peng T‐R, Lin H‐H, Yang L‐J, Huang Y‐Y, Wu T‐W, Chao Y‐C. The impact of inflammatory bowel disease on dementia risk: a current systematic review and meta‐analysis. Sci Rep. 2025;15:12852. doi: 10.1038/s41598-025-96331-w - DOI - PMC - PubMed
    1. Zong J, Yang Y, Wang H, Zhang H, Yang X, Yang X. The two‐directional prospective association between inflammatory bowel disease and neurodegenerative disorders: a systematic review and meta‐analysis based on longitudinal studies. Front Immunol. 2024;15:1325908. doi: 10.3389/fimmu.2024.1325908 - DOI - PMC - PubMed
    1. Pistollato F, Sumalla Cano S, Elio I, Masias Vergara M, Giampieri F, Battino M. Role of gut microbiota and nutrients in amyloid formation and pathogenesis of Alzheimer disease. Nutr Rev. 2016;74:624‐634. doi: 10.1093/nutrit/nuw023 - DOI - PubMed
    1. Talley S, Valiauga R, Anderson L, Cannon AR, Choudhry MA, Campbell EM. DSS‐induced inflammation in the colon drives a proinflammatory signature in the brain that is ameliorated by prophylactic treatment with the S100A9 inhibitor paquinimod. J Neuroinflammation. 2021;18:263. doi: 10.1186/s12974-021-02317-6 - DOI - PMC - PubMed

LinkOut - more resources