. 2025 Oct 9;135(23):e197807.
doi: 10.1172/JCI197807. Online ahead of print.

Kidney-specific claudin-2 deficiency leads to medullary nephrocalcinosis in mice

Affiliations

Kidney-specific claudin-2 deficiency leads to medullary nephrocalcinosis in mice

Christine V Behm et al. J Clin Invest. .

Abstract

Deposits of hydroxyapatite called Randall's plaques are found in the renal papilla of calcium oxalate kidney stone formers and likely serve as the nidus for stone formation, but their pathogenesis is unknown. Claudin-2 is a paracellular ion channel that mediates calcium reabsorption in the renal proximal tubule. To investigate the role of renal claudin-2, we generated kidney tubule-specific claudin-2 conditional knockout mice (KS-Cldn2 KO). KS-Cldn2 KO mice exhibited transient hypercalciuria in early life. Normalization of urine calcium was accompanied by a compensatory increase in expression and function of renal tubule calcium transporters, including in the thick ascending limb. Despite normocalciuria, KS-Cldn2 KO mice developed papillary hydroxyapatite deposits, beginning at 6 months of age, that resembled Randall's plaques and tubule plugs. Bulk chemical tissue analysis and laser ablation-inductively coupled plasma mass spectrometry revealed a gradient of intrarenal calcium concentration along the corticomedullary axis in normal mice, that was accentuated in KS-Cldn2 KO mice. Our findings provide evidence for the "vas washdown" hypothesis for Randall's plaque formation, and identify the corticomedullary calcium gradient as a target for therapies to prevent kidney stone disease.

Keywords: Calcium; Epithelial transport of ions and water; Metabolism; Nephrology; Tight junctions.


Conflict of interest statement

Conflict of interest: ASLY has served as a consultant or advisory board member for Regulus, Calico, Sarepta, Travere, Torque Bio, and Estuary and received royalties from Elsevier and Wolters-Kluwer.

Figures

Figure 1
Figure 1. General phenotype of constitutive, kidney-specific Cldn2-KO mice.
(A) Western blot for claudin-2 in kidney and colon tissue from KO mice (Cre+) and control littermates (Cre). (B) Cldn2 mRNA expression by quantitative PCR in kidneys, relative to ezrin, plotted as 2–ΔCt values. Differences are significant for genotype (P < 0.001), age (P = 0.03 for 10 vs. 4 weeks), and sex (P = 0.04) by 3-way ANOVA. (C) Immunofluorescence staining of kidney cortex and medulla with antibodies to claudin-2 (green) and ZO-1 (red). Orange/yellow fluorescence indicates colocalization of claudin-2 with ZO-1. Claudin-2 is detectable at the tight junctions (arrowheads) and basolateral membrane (arrows) of PTs in the cortex, and in thin descending limbs in the medulla of Cre control but not Cre+ KO mice. Scale bars: 50 μm. (D) GFR determined from FITC-sinistrin clearance. n = 10–13 per group. (E) Determination of fractional excretion of lithium. Following pretreatment with bumetanide to block thick ascending limb sodium and lithium transport, male mice were given an i.v. bolus of LiCl, and plasma creatinine concentration, plasma lithium (mean of samples 3 minutes and 60 minutes after injection), and lithium excretion in a 1-hour urine collection were determined. n = 5 per group. (F) Systolic BP determined by tail cuff measurement. n = 10–13 per group.
Figure 2
Figure 2. Elevated urine calcium excretion in young but not older Cldn2-KO mice.
(A) Urine calcium/creatinine ratio in kidney-specific Cldn2-KO mice. Levels are higher in Cre+ compared with Cre mice (least squares mean difference ± SE = 0.143 ± 0.046, P = 0.002) and decrease more rapidly with age (P = 0.002 for genotype × age interaction), with no difference between the sexes, using LMM. (B) Urine calcium/creatinine ratio in global, constitutive Cldn2-KO mice. Levels are higher in KO mice than control littermates (least squares mean difference ± SE = 0.193 ± 0.039, P < 0.001), but there is no significant interaction with age. Age group >12 months included mice ranging from 63 to 101 weeks old. n = 2–13 per group.
Figure 3
Figure 3. Induction of hypercalciuria within a week in inducible kidney-specific Cldn2-KO mice.
(A) Western blot for claudin-2 in whole kidney lysates from KO mice (Cldn2fl/y, Pax8-LC1) treated with doxycycline (Dox) or vehicle (lane 1) and control littermates without the Pax8 and/or LC1 genes (lanes 4 and 5). (B) Immunofluorescence staining of kidney sections with antibodies to claudin-2 (green) and ZO-1 (red). The upper panels show kidney cortex, where claudin-2 is detectable at the tight junctions (arrowheads) and basolateral membrane (arrow) of PTs in the control mouse (left) and absent in the KO mouse (right). The lower panels show the inner stripe of outer medulla, where claudin-2 localized to the thin descending limbs (arrows) is only mildly reduced in the KO compared with control. Claudin-2 deletion in the thin descending limbs was incomplete even after 3 weeks of doxycycline induction (not shown). Scale bars: 50 μm. (C) Urine calcium/creatinine (Ca/Cr) ratio before and after 1 week of doxycycline or vehicle (Veh) in inducible KO mice (Cre+) or control littermates without LC1 (Cre). Bars represent mean ± SEM. P value is shown for interaction of time with the group Cre+ Dox, by repeated-measures LMM.
Figure 4
Figure 4. Analysis of response to hypercalciuria in constitutive kidney-specific Cldn2-KO mice shows compensatory upregulation of PTH.
(A) Serum calcium, intact PTH, and 1,25-dihydroxyvitamin D levels. n = 3–9 per group. (B) Total body, lumbar spine, and femur bone mineral density (BMD) between 4 and 10 weeks of age. n = 4–11 in all groups except 4-week-old Cre+ female (n = 1). P = 0.0008 for the effect of genotype on PTH levels by 3-way ANOVA. For all other measures, P is nonsignificant for genotype and its interactions with sex and age.
Figure 5
Figure 5. Compensatory upregulation of mRNA expression of thick ascending limb and distal convoluted tubule calcium transporters in constitutive kidney-specific Cldn2-KO mice.
Expression levels for each gene by quantitative PCR, relative to ezrin, are plotted as 2–ΔCt values. P values are reported for differences between genotype (Cre+ vs. Cre) by 3-way ANOVA with between-group factors of age, sex and genotype. Sex as a factor was not significant, so males and females are grouped for presentation. n = 6–7 per age group and genotype.
Figure 6
Figure 6. Diuretic challenge assay unmasks enhanced thick ascending limb calcium reabsorption in constitutive kidney-specific Cldn2-KO mice.
(A) Diagram of experimental protocol. Four-hour urine collections (blue) were taken at baseline (Base) a day prior to sequential injections with vehicle, followed the next day with diuretic, either furosemide (Fur) or hydrochlorothiazide (HCTZ). The 2 diuretics were separated by an interval of 1 week. Diet was switched to gel formulation on day –1 to ensure adequate hydration. Effect of furosemide (B) and hydrochlorothiazide (C) compared with vehicle on urine volume, sodium excretion, and calcium excretion. Urine measurements were modeled by LMM with between-subject effects of genotype and sex, within-subject effect of treatment, and the interaction of genotype and sex with treatment. n = 15–19 per group. The statistically significant fixed effects are listed below each panel.
Figure 7
Figure 7. Nephrocalcinosis in older kidney-specific Cldn2-KO mice.
(A) Alizarin red staining of the renal inner medulla of 1-year-old female Cre and Cre+ mice. Scale bar: 400 µm. (B) Left: Papilla of a 16 month-old female Cre+ mouse stained with alizarin red. Right: High-magnification view of Yasue-stained section showing large intratubular plugs and smaller interstitial granular deposits (yellow arrows). (C) Infrared analysis of mineral deposits. Top panels: Yasue-stained section showing extensive mineral deposition in renal papilla. Inset: False-color representation of spectrum field with infrared microscope; square is 400 x 400 μm. Bottom panels: Spectra from mineral locations 1–3, indicated in the inset, along with standard spectra for apatite and calcite (calcium carbonate). (D) Micro-CT scans of the kidneys from A at bone density setting to detect mineral deposits. (E) Quantitation of mineral volume as a proportion of total kidney volume (P = 0.0036 for effect of genotype by 3-way ANOVA).
Figure 8
Figure 8. Enhanced papillary Ca content in 4- to 6-month-old kidney-specific claudin-2–KO mice.
Bulk chemical analysis of the axial distribution of tissue calcium in mouse kidney. (A) Dissection of mouse kidney. Coronal section through kidney on left; and dissection of 3 regions on right. C, cortex; OM, outer medulla and base of inner medulla; P, papilla. Small tick marks on the ruler represent 1 mm intervals. (B) Comparison of 2 methods of tissue calcium extraction (acid ash and diffusible calcium) in WT mice. (C and D) Kidney calcium content relative to tissue wet weight (C) or dry weight (D) in kidney-specific claudin-2–KO mice (Cre+) as compared with control littermates (Cre). Data were analyzed with multilevel LMMs, with kidney region as the level 1 unit, nested within individual mice as level 2. Statistically significant P values are reported for the fixed effects of kidney region (papilla or outer medulla, relative to cortex as the reference), genotype, and sex and their interactions. n = 3–9 mice per group.
Figure 9
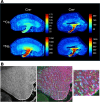
Figure 9. Elemental mapping by LA-ICP MS in 6-week-old mouse kidneys.
(A) 2D maps of calcium (44Ca) and sodium (23Na) in midline coronal kidney sections of Cldn2 kidney-specific KO (Cre+) and control (Cre) mice. Color scale represents concentration in ppm. (B) High-resolution image of a Cre+ mouse papilla. Left: 44Ca map at 2 μm resolution. Middle: Overlay of 44Ca map (magenta) with immunofluorescence labeling of an adjacent section with AQP1 (green) and AQP2 (cyan). Region delineated by the white square is magnified in the right panel. The appearance of a stippled pattern in the calcium channel is consistent in size with individual laser spots and indicates that calcium is homogeneously distributed.
Figure 10
Figure 10. Elemental corticomedullary concentration profiles.
Profiles for 23Na (A) and 44Ca (B). Element concentrations in parts per million (ppm) are plotted on a log scale. Distance is measured from the cortical surface in millimeters. Kidney sections from each individual mouse are represented by a different color (n = 4–5 mice per group). Black lines and shaded bands represent the LMM predictions from marginal means and their 95% confidence intervals. P values are reported for slope of log-concentration versus distance.

References

    1. Tasian GE, et al. Annual incidence of nephrolithiasis among children and adults in South Carolina from 1997 to 2012. Clin J Am Soc Nephrol. 2016;11(3):488–496. doi: 10.2215/CJN.07610715. - DOI - PMC - PubMed
    1. Bushinsky DA, et al. Nephrolithiasis. In: Taal MW, et al, eds. Brenner and Rector’s The Kidney. Elsevier; 2012:1455–1507.
    1. Pak CY, et al. The hypercalciurias. Causes, parathyroid functions, and diagnostic criteria. J Clin Invest. 1974;54(2):387–400. doi: 10.1172/JCI107774. - DOI - PMC - PubMed
    1. Sutton RA, Walker VR. Responses to hydrochlorothiazide and acetazolamide in patients with calcium stones. Evidence suggesting a defect in renal tubular function. N Engl J Med. 1980;302(13):709–713. doi: 10.1056/NEJM198003273021302. - DOI - PubMed
    1. Coe FL, et al. Effects of low-calcium diet on urine calcium excretion, parathyroid function and serum 1,25(OH)2D3 levels in patients with idiopathic hypercalciuria and in normal subjects. Am J Med. 1982;72(1):25–32. doi: 10.1016/0002-9343(82)90567-8. - DOI - PubMed

LinkOut - more resources