. 2025 Oct 9;21(10):e1013517.
doi: 10.1371/journal.pcbi.1013517. eCollection 2025 Oct.

Superspreading and the evolution of virulence

Affiliations

Superspreading and the evolution of virulence

Xander O'Neill et al. PLoS Comput Biol. .

Abstract

Superspreading, where a small proportion of a population can cause a high proportion of infection transmission, is well known to be important to the epidemiology of a wide range of pathogens, including SARS-CoV-2. However, despite its ubiquity in important human and animal pathogens, the impact of superspreading on the evolution of pathogen virulence is not well understood. Using theory and both deterministic and stochastic simulations we examine the evolution of pathogen virulence under a range of different distributions of infection transmission for the host. Importantly, for many pathogens, superpreader events may be associated with increased tolerance to infection or asymptomatic infection and when we account for this superspreading selects for higher virulence. In contrast, in animal populations where highly connected individuals, that are linked to superspreader events, also have fitness benefits, superspreading may select for milder pathogens. In isolation, the transmission distribution of the host does not impact selection for pathogen virulence. However, superspreading reduces the rate of pathogen evolution and generates considerable variation in pathogen virulence. Therefore, the adaptation of an emerging infectious disease, that exhibits superspreading, is likely to be slowed and characterised by the maintenance of maladaptive variants. Taken as a whole, our results show that superspreading can have important impacts on the evolution of pathogens.


Conflict of interest statement

The authors have declared that no competing interests exist.

Figures

Fig 1
Fig 1. (a) The distribution of host transmission levels for different shape parameters of the gamma distribution, k, showing the probability of hosts being born, pi, with a particular level of transmission, ci.
As k increases the transmission distribution transitions from superspreading to homogeneous. The red line shows the exact gamma distribution and the blue bars our discretised version used in simulations. The mean transmission level is the same in all distributions. In (b) we highlight possible transmission events from an infected individual (red) that can infect individuals (yellow) from a pool of susceptible individuals (green). We capture superspreading, where an individual may infect few individuals (top left) or many individuals (top right), and a homogeneous transmission distribution where an infected individual always infects the same number of susceptible individuals (bottom left and right). In (c) we show a schematic of our model (Eq 1) highlighting how infection from an infected of type Ij of a susceptible of type Si leads to an infected of type Ii. Fig 1 was produced by the authors, with Fig 1a obtained using MATLAB 2023b, and Fig 1b and 1c designed and produced by XO using Adobe Illustrator.
Fig 2
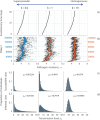
Fig 2. The effect of superspreading on the evolution of virulence for the SI model when infection transmission for the host is independent of other host characteristics.
In (a) and (b) we show the evolution of pathogen virulence over time under different transmission distributions. In (a) we show the deterministic simulations and (b) we show the stochastic simulations (and note the vertical axis is different for k = 0.2 compared to k = 1 and k = 10). In (c) we show the proportion of susceptible individuals in each transmission class, ci and (d) the proportion of infected individuals in each transmission class. All proportions are shown at the evolutionary stable level of pathogen virulence, α*, in the deterministic simulations. The mean level of transmission, μc, is also shown for each distribution. The variance in α over the last 1000 time points of the stochastic simulations is as follows: k = 0.2, variance=1.6; k = 1, variance=0.34; k = 10, variance=0.23. Parameters are taken from Table 1.
Fig 3
Fig 3. The evolution of virulence for the SI model when contacts are linked to host survival.
(a) The evolved level of pathogen virulence, α*, for different transmission distributions for the host (characterised by changes in k), and with rates of host natural death, d(ci), linked to host transmission level, ci. (b) The function d(ci) where the host death rate decreases with increases in host transmission level (increased connectivity). Results are obtained from deterministic simulations using parameters as in Fig 2 and the function d(ci)=43.75ci2/(25+ci2).
Fig 4
Fig 4. The evolution of virulence for the SI model when transmission is linked to tolerance or vulnerability.
(a) The evolved level of pathogen virulence, α*, for different transmission distributions for the host (characterised by changes in k), and with the function h(ci), linked to host transmission level, ci. (b) The function h(ci) where increases in ci lead to increased tolerance (a decrease in h(ci)). (c) The function h(ci) where increases in ci lead to increased vulnerability (a increase in h(ci)). Results are obtained from deterministic simulations using parameters as in Fig 2 and the functions (b) h(ci)=21.75ci2/(75+ci2) and (c) h(ci)=0.5+3.5ci2/(600+ci2).

References

    1. Gavier-Widén D, Ståhl K, Dixon L. No hasty solutions for African swine fever. Science. 2020;367(6478):622–4. doi: 10.1126/science.aaz8590 - DOI - PubMed
    1. Lycett SJ, Duchatel F, Digard P. A brief history of bird flu. Philos Trans R Soc Lond B Biol Sci. 2019;374(1775):20180257. doi: 10.1098/rstb.2018.0257 - DOI - PMC - PubMed
    1. Marani M, Katul GG, Pan WK, Parolari AJ. Intensity and frequency of extreme novel epidemics. Proc Natl Acad Sci U S A. 2021;118(35):e2105482118. doi: 10.1073/pnas.2105482118 - DOI - PMC - PubMed
    1. Sachs JD, Karim SSA, Aknin L, Allen J, Brosbøl K, Colombo F, et al. The Lancet Commission on lessons for the future from the COVID-19 pandemic. Lancet. 2022;400(10359):1224–80. doi: 10.1016/S0140-6736(22)01585-9 - DOI - PMC - PubMed
    1. Heesterbeek H, Anderson RM, Andreasen V, Bansal S, De Angelis D, Dye C, et al. Modeling infectious disease dynamics in the complex landscape of global health. Science. 2015;347(6227):aaa4339. doi: 10.1126/science.aaa4339 - DOI - PMC - PubMed