. 2025 Oct 9;21(10):e1011896.
doi: 10.1371/journal.pgen.1011896. eCollection 2025 Oct.

A genetic screen reveals a key role for Reg1 in 2-deoxyglucose sensing and yeast AMPK inhibition

Affiliations

A genetic screen reveals a key role for Reg1 in 2-deoxyglucose sensing and yeast AMPK inhibition

Alberto Ballin et al. PLoS Genet. .

Abstract

The yeast Saccharomyces cerevisiae thrives in sugar-rich environments by rapidly consuming glucose and favoring alcoholic fermentation. This strategy is tightly regulated by the glucose repression pathway, which prevents the expression of genes required for the utilization of alternative carbon source. Central to this regulatory network is the yeast ortholog of the heterotrimeric 5'AMP-activated protein kinase (AMPK), which adjusts gene expression in response to glucose availability. The activity of the yeast AMPK complex is primarily regulated by the phosphorylation state of its catalytic subunit Snf1, a process orchestrated by a balance between upstream kinases and phosphatases. Among the latter, the Protein Phosphatase 1 (PP1) complex Reg1/Glc7 plays a critical role in inhibiting Snf1 activity under glucose-rich conditions. Despite its importance, the precise mechanism by which glucose availability leads to Snf1 inhibition remains incompletely understood. Evidence suggests that hexokinase 2 (Hxk2) participates in this pathway, potentially coupling the early steps of glucose metabolism to Snf1 signaling. Notably, the toxic glucose analog 2-deoxyglucose (2DG)- which is phosphorylated by Hxk2 but not further metabolized- mimics glucose in its ability to repress Snf1, implicating glucose or 2DG phosphorylation as a key regulatory signal. Additionally, yeast AMPK activity correlates with 2DG resistance through mechanisms that are incompletely described. In this study, we performed a large-scale 2DG-resistance genetic screen to explore both the molecular basis of 2DG resistance and AMPK regulation in yeast. The identified mutations confer resistance either by reducing 2DG phosphorylation (e.g., mutations in HXK2) or by enhancing constitutive Snf1 activity, via gain-of-function alleles in AMPK subunits or loss-of-function mutations in REG1 and GLC7. We also describe a novel series of REG1 missense mutations, including reg1-W165G, that maintain basal, glucose-regulated Snf1 activity but fail to mediate 2DG-induced Snf1 inhibition. These findings position Reg1 as a central mediator in glucose sensing, possibly by sensing 2DG-derived -and by extension, glucose-derived- metabolites.


Conflict of interest statement

The authors have declared that no competing interests exist.

Figures
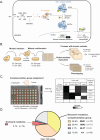
Fig 1
Fig 1. Genetic screen for isolation of 2DG mutants and genetic analysis.
A. Working model for the regulation of yeast SNF1 activity by glucose availability. Glucose enters the cell through hexose transporters (Hxt) and is phosphorylated to glucose-6-phosphate by the main hexokinase isoform Hxk2, as well as by Hxk1 and Glk1, initiating glycolysis. A yet unidentified metabolic signal generated during these early steps (“?”) promotes the dephosphorylation of Snf1, the catalytic (α) subunit of the yeast AMPK complex, thereby maintaining Snf1 in an inactive state. This inactivation requires the PP1 phosphatase, composed of the regulatory subunit Reg1 and the catalytic subunit Glc7. Snf1 activity determines the phosphorylation status of Mig1, a transcriptional repressor responsible for glucose-dependent repression of genes involved in respiration and the utilization of alternative carbon sources. When glucose is scarce, PP1 no longer acts on Snf1, allowing its activation. Active Snf1 phosphorylates Mig1, relieving glucose repression and enabling expression of genes required for the use of non-glucose substrates. B. Schematic of the experimental setting used for the isolation of spontaneous 2DG-resistant mutants. WT cells were plated on selective medium containing 2% glucose supplemented with 0.2% 2DG. 195 colonies (representing resistant mutants) were picked for further studies. Their resistance phenotype was confirmed by an additional selection on 2DG. Mutants were then subject to complementation group tests and to growth assay in various conditions. The mutants were spotted using a robot for high-throughput manipulation of microorganisms. C. Schematic of the workflow used for the quantification of the diploids’ growth and their assignment to a complementation group. Colony size after 3 days of growth was quantified using ImageJ and compared to control strains. A threshold was chosen to affiliate mutants as part of a complementation group (see Material and Methods). The data is shown in S1 Table, representing growth of diploids derived from crosses of each mutant with control strains (hxk2∆, glc7-Q48P, reg1∆). D. Pie-chart showing mutant distribution within the complementation groups and the proportion of unassigned and dominant mutants.
Fig 2
Fig 2. Dominant alleles in three subunits of SNF1/yAMPK.
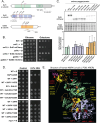
A. Schematic of the three proteins composing the SNF1 complex, highlighting their domains and the position of the mutations found in the genetic screen. KD: kinase domain; AID: auto-inhibitory domain; CBM: carbohydrate-binding module; CBS: cystathionine beta-synthase domains. B. Growth assay of the mentioned strains, transformed with plasmids expressing the indicated mCherry-tagged proteins. Serial dilutions of yeast cultures were spotted on a synthetic medium (uracil drop-out) containing 2% glucose or 2% galactose and grown for 3 days at 30°C. C. Top, Total protein extracts of cells from the mentioned genotype, transformed with plasmids expressing the indicated WT or mutant protein, tagged with mCherry, were immunoblotted using an anti-RED antibody. Bottom, Histogram showing the abundance of the indicated mutant proteins, normalized to total proteins and relative to the corresponding WT protein (n = 4; ± SEM). Paired t-test revealed no significant expression changes between any of the mutants and their corresponding WT protein. D. Growth assay of the mentioned strains, transformed with plasmid expressing the indicated mCherry-tagged protein. Serial dilutions of yeast cultures were spotted on synthetic medium (uracil drop-out) containing 2% glucose supplemented or not with 0.2% 2DG, and grown for 3 days at 30°C. E. Position of the residues targeted by mutations on the structure of human AMPK (⍺1β2ɣ1, PDB: 4RER [68]). Orange: hAMPK β2 subunit, green: hAMPK ⍺1 subunit, blue: hAMPK ɣ1 subunit. Residues targeted by mutations and conserved in human proteins are shown in yellow (this study) or in red (previous studies, see text). The position of the conserved residue in the human protein is indicated between parentheses. Ligands such as AMP molecules and β-cyclodextrins are indicated in red and purple, respectively.
Fig 3
Fig 3. Analysis of mutants in GLC7.
A. Schematic representation of the Glc7 protein. The catalytic domain, residues involved in the binding of regulatory subunits and mutations found in the screen are highlighted. B. Phenotypes of the indicated strains (WT, reg1∆, control glc7-Q48P and three clones from the screen carrying a mutation in GLC7) on plate. Saturated liquid cultures were pinned in quadruplicate on the indicated media using a robot for high-throughput screening and incubated at 30°C for 3 days. Iodine treatment was performed by exposing the plates to iodine crystals for 2 minutes before scanning. C. Growth assay of the indicated strains complemented or not with a centromeric plasmid allowing the expression of Glc7-GFP under the control of its endogenous promoter. Serial dilutions of yeast cultures were spotted on synthetic medium (uracil drop-out) containing 2% glucose, supplemented or not with 0.2% 2DG, and grown for 3 days at 30°C. D. Position of the residues targeted by mutations on the structure of Glc7. Left, three-dimensional structure of Glc7 in complex with a portion of its regulatory subunit Ref2 (PDB accession: 8A86; [76]); Right: AlphaFold modeling of Glc7 in complex with a portion of Reg1 containing the RHIHF motif required for interaction with Glc7 (residues 450-500). Blue: Glc7; Yellow: Ref2/Reg1, spheres indicate residues composing the degenerate RVxF motif; Pink: residues of Glc7 known to be involved in the binding to its regulatory subunits; Red: residues for which mutations were identified in this study.
Fig 4
Fig 4. Analysis of mutants in REG1.
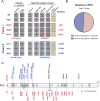
A. Phenotypes of the indicated strains (haploids or diploids, as indicated) on plate. Saturated liquid cultures were pinned in quadruplicate on the indicated media using a robot for high-throughput screening and incubated at 30°C for 3 days. Iodine treatment was performed by exposing the plates to iodine crystals for 2 minutes before scanning. The growth of a few REG1 mutants and of control strains is shown. Representatives of class I mutants (red) and class II mutants (blue) are indicated. B. Pie-chart showing the proportion of nonsense (class I) and missense (class II) mutations predicted from phenotypic characterization of mutants assigned to the REG1 complementation group (see S2 Table). C. Schematic representation of the Reg1 protein. A putative domain of unknown function (DUF1752) is indicated, together with class I (red) and class II (blue) mutations identified in the genetic screen. M1R and M1I are point mutations in the start codon causing substitution into Arg and Ile, respectively, and behave like a nonsense mutation. Mutation F468C targets the Glc7-interaction motif (RHIHF) and also behaves like a nonsense mutation. Asterisks indicate the position of the stop codon in the protein.
Fig 5
Fig 5. Mutants carrying missense mutations in Reg1 are competent for glucose repression.
A. Heatmap displaying the normalized growth of WT, reg1∆ or reg1∆ cells transformed with a plasmid expressing the indicated Reg1-FLAG allele. Saturated liquid cultures were pinned in quadruplicate on the indicated media using a robot for high-throughput screening and incubated at 30°C for 3 days before scanning. Growth was normalized to the WT in each condition. B. Histogram representing the activity of a pDOG2::lacZ construct in reg1∆ cells transformed with plasmid expressing the indicated Reg1-FLAG allele, normalized to WT signal (n = 3, ± SEM). C, D. Histogram representing the normalized (to WT) abundance of Dog2-GFP (C) and Suc2 (D) in reg1∆ cells transformed with plasmids expressing the indicated Reg1-FLAG allele. Quantification of western blots on total protein extracts of cells growing in exponential phase after overnight growth at 30°C. (n = 3 ± SEM). For panels B-D, * and ** indicate the p-value of statistical comparisons with respect to the strain expressing WT Reg1-FLAG. *: p < 0.05; **: p < 0.01. No indication means not significant.
Fig 6
Fig 6. Initial characterization of Reg1 point mutants.
A. Schematic representation of the Reg1 protein. The DUF1752 domain is highlighted, together with the five missense mutations carried by the mutants further characterized in this study. B. Left, Total protein extracts of cells from the mentioned genotype, transformed or not with plasmids expressing the indicated Reg1-FLAG alleles, were immunoblotted using an anti-FLAG antibody. Right, Histogram showing Reg1, WT or mutant, abundance normalized to the WT. C. Total protein extracts of cells from the mentioned genotype, transformed or not with plasmids expressing the indicated Reg1-FLAG alleles, were immunoprecipitated using anti-FLAG antibodies and immunoblotted using anti-FLAG (Reg1), anti-GFP (Glc7 and Snf1) and anti-14-3-3s (14-3-3 proteins) antibodies. Left, total extracts before immunoprecipitation, Right, immunoprecipitations. D. Histogram displaying the quantification of the ratio of the detected signal for each protein over Reg1-FLAG, detected in the immunoblots of B. B and D. n = 3. error bars = SEM, ** indicate the p-value of statistical comparisons: **: p < 0.01. No indication means not significant.
Fig 7
Fig 7. Characterization of the 2DG response in Reg1 point mutants.
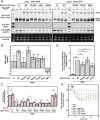
A. Total protein extracts of cells from the mentioned genotype, expressing Snf1-GFP (endogenously tagged) and Mig1-FLAG (centromeric plasmid) and transformed or not with a plasmid expressing the indicated Reg1-FLAG alleles, were prepared before and after 2DG addition for 10’, and immunoblotted using anti-FLAG (Reg1 and Mig1), anti-GFP (Snf1) and anti-pAMPK (pSnf1) antibodies. B. Histogram representing the shift of Mig1 (0’ vs. 10’ treatment) in the indicated mutant in pixels, as measured using the ImageQuant TL software. C. Histogram representing Snf1 phosphorylation state (pSnf1/Snf1tot) in the mentioned strains, before or after 2DG treatment. * on top of the bars: 0’ vs. 10’ 2DG treatment, * inside the bars: comparison of the 0’ 2DG time point to the WT. D. Intracellular 2DG6P was assayed enzymatically (see Methods) in reg1∆, WT and reg1∆ cells transformed with the indicated Reg1-FLAG alleles. Cells were grown overnight in a glucose-containing medium and treated or not for 15 min with 0.2% 2DG. Values are normalized to the value of the WT (15’). E. Cells expressing an ATP FRET biosensor and the mentioned mutant Reg1-FLAG protein were grown overnight in a glucose-containing medium and treated with 0.2% 2DG (arrow). The FRET ratio (535/570 nm) was measured over time in a plate reader (see Methods) and is represented as the ratio between treated and non-treated cells (n = 4). B-D. n = 3, error bars = SEM, * indicate the p-value of statistical comparisons: *P < 0.05; **P < 0.01.
Fig 8
Fig 8. Characterization of the 2DG response in Reg1 point mutants, focusing on Rod1 dephosphorylation and function.
A. Total protein extracts of cells from the mentioned genotype, expressing Rod1-FLAG and transformed or not with plasmid expressing the indicated Reg1-FLAG alleles, were prepared before and after 2DG addition for 10’, and immunoblotted using anti-FLAG (Reg1 and Rod1), anti-GFP(Snf1) and anti-pAMPK (pSnf1) antibodies. B. Histogram representing Snf1 phosphorylation state (pSnf1/Snf1tot) in the mentioned strains, before or after 2DG treatment. * on top of the bars = 0’ vs. 10’ 2DG treatment, * inside the bars, comparison of the 0’ 2DG time point to the WT. n = 3, error bars = SEM, * indicate the p-value of statistical comparisons: *P < 0.05; **P < 0.01; ***P < 0.001; ****P < 0.0001. C. Cells expressing Hxt3-mCherry and WT or mutant Reg1-GFP were grown in a glucose-containing medium and observed by fluorescence microscopy before and after 2DG treatment for 150’. Scale bar, 5 μm. D. Quantification of the signal detected at the plasma membrane over the total cellular signal (n = 60 cells).
Fig 9
Fig 9. The Reg1-W165G mutant is specifically affected for 2DG sensing.
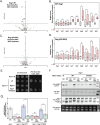
A,C. Cells expressing WT or mutant Reg1-FLAG were grown to exponential phase overnight and treated with 2DG for 15’. Cells were lysed before and after treatment, Reg1-FLAG was immunoprecipitated and the immunoprecipitates were analyzed by quantitative, label-free proteomics. Volcano plots indicate proteins identified by mass spectrometry of WT or mutant Reg1-FLAG, before or after 2DG treatment, with -log(p value) as a function of log2(untreated/treated ration). B,D. Box-plots comparing the relative abundance of 9 proteins measured by mass spectrometry before and after 2DG treatment (relative areas of the peaks, normalized to untreated sample for each protein). E. Growth assay of the indicated strains complemented or not with a centromeric plasmid allowing the expression of Reg1-Flag (WT or mutant) under the control of its endogenous promoter. Serial dilutions of yeast cultures were spotted on synthetic medium containing 2% sucrose, supplemented or not with 0.2% 2DG, and grown for 3 days at 30°C. F. Total protein extracts were prepared from cells of the indicated phenotype expressing Rod1-FLAG and WT or mutant Reg1. Cells grown in 2% glucose-containing medium were either treated with 2DG or resuspended in 0.05% glucose-containing medium (-Glc) for 10’. 2% glucose was then added to starved cells for 10’. The extracts were immunoblotted using anti-FLAG (Reg1 and Rod1), anti-GFP (Snf1) and anti-pAMPK (pSnf1) antibodies. A-D. n = 4, p-value of statistical comparisons: *p < 0.05; ** p < 0.01; ** p < 0.001; **** p < 0.0001. G. Quantification of Snf1 phosphorylation from panel F. n = 3, error bars: SEM, * indicate the p-value of statistical comparisons: **p < 0.05; ** p < 0.01.

References

    1. Bai F-Y, Han D-Y, Duan S-F, Wang Q-M. The Ecology and Evolution of the Baker’s Yeast Saccharomyces cerevisiae. Genes (Basel). 2022;13(2):230. doi: 10.3390/genes13020230 - DOI - PMC - PubMed
    1. Conrad M, Schothorst J, Kankipati HN, Van Zeebroeck G, Rubio-Texeira M, Thevelein JM. Nutrient sensing and signaling in the yeast Saccharomyces cerevisiae. FEMS Microbiol Rev. 2014;38(2):254–99. doi: 10.1111/1574-6976.12065 - DOI - PMC - PubMed
    1. Hedbacker K, Carlson M. SNF1/AMPK pathways in yeast. Front Biosci. 2008;13:2408–20. doi: 10.2741/2854 - DOI - PMC - PubMed
    1. Coccetti P, Nicastro R, Tripodi F. Conventional and emerging roles of the energy sensor Snf1/AMPK in Saccharomyces cerevisiae. Microb Cell. 2018;5(11):482–94. doi: 10.15698/mic2018.11.655 - DOI - PMC - PubMed
    1. Zimmermann FK, Scheel I. Mutants of Saccharomyces cerevisiae resistant to carbon catabolite repression. Mol Gen Genet. 1977;154(1):75–82. doi: 10.1007/BF00265579 - DOI - PubMed

MeSH terms

LinkOut - more resources