. 2025 Oct 9;16(1):8996.
doi: 10.1038/s41467-025-64036-3.

mTOR dysregulation induces IL-6 and paracrine AT2 cell senescence impeding lung repair in lymphangioleiomyomatosis

Affiliations

mTOR dysregulation induces IL-6 and paracrine AT2 cell senescence impeding lung repair in lymphangioleiomyomatosis

Roya Babaei-Jadidi et al. Nat Commun. .

Abstract

Lymphangioleiomyomatosis (LAM) is a rare disease of women in which TSC2 deficient 'LAM cells' with dysregulated mTOR signalling and recruited fibroblasts form nodules causing lung cysts and respiratory failure. We examine if mTOR dysregulation can induce senescence and impair the response to lung injury in LAM. The senescence markers p21, p16 and the SenMayo gene set are increased in LAM lungs and colocalise with alveolar type 2 cells. LAM models induce mTOR dependent senescence in alveolar type 2 cell organoids in vitro and in vivo. IL-6 produced by LAM cells, induces p16 and p21 in alveolar type 2 cells, inhibits epithelial wound resolution and is related to lung function in LAM patients. Rapamycin and the IL-6 receptor antagonist Tocilizumab reduce alveolar type 2 cell organoid p21 accumulation and Tocilizumab enhances epithelial wound repair. Targeting IL-6 signalling in parallel with mTOR inhibition, may reduce lung damage in LAM.


Conflict of interest statement

Competing interests: The authors declare no competing interests.

Figures
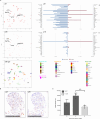
Fig. 1
Fig. 1. Markers of senescence in LAM lung.
A Single cell RNA sequencing of LAM lung tissues showing expression of p16 and p21 in LAM lung populations using the LAM cell atlas. Left panels show expression of positive cells for p21 and p16 in each cluster, right panels show the fold change and significance for LAM. Lower panel shows cell types present in LAM lung samples. AT1 = alveolar type 1 cells, AT2 = alveolar type 2 cells, PATS = pre-alveolar type-1 transitional cell state. B Immunostaining of LAM nodules for p16 and p21 protein, representative images of 21 LAM and 3 control lung sections. C Senescence associated beta galactosidase (SAβgal) activity in albino C57BL/6 mouse lungs after TSC2-/- cell injection or control (no cells). Graph shows mean (SD) of three animals per group and three technical replicates. 8-week points compared by unpaired two-tailed Student’s t-test **p = 0.004. Source data are provided as a Source Data file.
Fig. 2
Fig. 2. Senescence in LAM nodules.
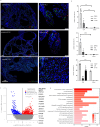
A Representative widefield and close up images of dual label immunohistochemical staining of p16 and p21 and the LAM cell markers PNL2 and GP100 respectively and the mesenchymal cell marker TCF21. B Quantification of senescence and LAM cell markers in LAM (n = 8, ≥3 replicates) and control lungs (n = 3, ≥3 replicates). Graphs show the mean (SD) percentage of positive, compared with all cells in the region of interest and the percentage of cells expressing both markers (co-loc) analysed by 2-way ANOVA. Source data and exact p-values are provided as a Source Data file. **p < 0.01, ****p < 0.0001. C Volcano plot showing differentially expressed genes assessed by RNA sequencing in LAM nodules isolated by laser capture micro-dissection from 19 women with LAM compared with three healthy control lungs. The 15 most significantly increased genes are listed. Differentially expressed genes (DEG) between LAM vs control were identified using DESeq241, which performs a two-sided test. The y-axis shows p value (<0.05) and the x-axis shows Log2(FC) (FC > 1.5). FDR was calculated but not used for the DEG selection due to the high sample variations. D Pathway analysis of laser captured LAM nodules showing the most strongly increased pathways. **p < 0.01, ****p < 0.0001. Toppgene suite was used for gene sets and pathway enrichment analysis, p value is calculated using a Fisher’s inverse chi-square method, a False Discovery Rate of <10% was applied.
Fig. 3
Fig. 3. AT2 cells are senescent in LAM.
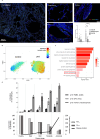
A Representative widefield and close up images of dual-label immunohistochemical staining of p21 and the AT2 cell marker surfactant protein C (SPC) around LAM nodules, in the cyst walls and in more normal areas of lung parenchyma. Similar findings were observed with p16 (Supplementary Fig. 7). Graph shows co-expression of SPC and senescence markers p16 and p21 in LAM (n ≥ 9, ≥3 replicates) and control (n = 5, ≥3 replicates). Data are presented as the mean (SD) percentage of positive cells relative to the total cells in regions of interest adjacent to LAM nodules or in control parenchyma. statistical analysis was performed using two-way ANOVA. Exact p-values are provided in the Source Data file (**p < 0.01, ****p < 0.0001). B Expression of the SenMayo gene set in control and LAM AT2 cells from LAM atlas. The coloured bar represents the module score of the SenMayo gene set in AT2 cells, computed as the sum of all SenMayo gene unique molecular identifiers expressed in AT2 cells, divided by the sum of all unique molecular identifiers expressed in AT2 cells. C Differentially expressed pathways in LAM compared with healthy control AT2 cells. DEGs were identified using Wilcoxon Rank-Sum Test (two-sided test) with p value < 0.05 and fold change >1.5 without multiple comparison correction. An FDR of <10% was applied for pathway and gene set enrichment analysis. D Evolution of senescence-related changes in LAM lung tissue. The lower panel shows the disease stage in LAM patients (n = 12, ≥ 4 replicates) and control lung (n = 3, 3 replicates). Patients were stratified by lung function deficit for forced expiratory volume in 1 second (FEV1) and lung diffusion of carbon monoxide (DLCO). Normal (assumed 100% predicted), early (mean FEV1 84 [18]%), mild (65 [14]%), moderate (53 [30]%), and advanced disease (18%). The corresponding upper panel shows co-immunostaining with p16, SPC, TCF21 or PMEL to identify senescent AT2, LAFs and LAM/mesenchymal cells, respectively. Graph shows mean ± SD of the percentage of each p16-positive population relative to the total respective lineage. Source data and exact p-values are provided as a Source Data file.
Fig. 4
Fig. 4. Senescence and IL-6 secretion increase with time and disease burden.
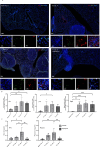
Time course of senescent cell and SASP generation was analysed in an animal model. TTJ cells or saline (sham) were injected into the tail veins of albino C57BL/6 mice, animals were treated with rapamycin or vehicle two weeks after cell injection, tissue, bronchoalveolar lavage fluid (BAL) and serum were harvested at 4 and 8 weeks after cell injection. A Senescent AT2 cells were quantified by dual immunostaining with SPC and p21, p16 or beta-galactosidase (βgal), representative images for p21 are shown. * highlights tumour nodules. B Quantification of mean (SD) dual expressing SPC / p21, p16 or βgal positive cells at different time points and the effect of the mTOR inhibitor rapamycin (n = 3 / group). Data analysed by one-way ANOVA. Source data and exact p-values are provided as a Source Data file. *p < 0.05, **p < 0.01, ***p < 0.001, ****p < 0.0001. C Mean (SD) IL-6 protein in plasma (n ≥ 4, duplicate) and bronchoalveolar lavage (BAL) (n ≥ 4, duplicate), data analysed by one-way ANOVA. Source data are and exact p-values provided as a Source Data file *p < 0.05, **p < 0.01.
Fig. 5
Fig. 5. AT2 cell senescence is mTOR dependent.
Tsc2 was deleted in mesenchymal cells using a Tbx4CreTsc2KO mouse. Animals were treated with rapamycin from birth and lung tissue harvested at 20 weeks of age. A Representative images of Tbx4CreTsc2KO animals with and without rapamycin. B Mean (SD) SAβgal/SPC, p21/SPC and p16/SPC dual positive AT2 cells were quantified in four animals / group including Tsc2 wild type control animals analysed by one way ANOVA (n = 4). Source data and exact p-values are provided as a Source Data file. *p < 0.05 **p < 0.01, ****p < 0.0001. C Expression of a panel of senescence associated genes from single cell RNA sequencing from LAM and healthy control AT2 cells. Single cell RNA sequencing from a single lung from a patient with LAM treated with the mTOR inhibitor rapamycin (LAM & rapa) showing suppression of senescence associated genes. D Dual immunostaining with SPC and p16 in lung tissue from a single lung transplant in a patient treated with the mTOR inhibitor Everolimus.
Fig. 6
Fig. 6. Cell-cell interactions induce senescence dependent on mTOR dysregulation.
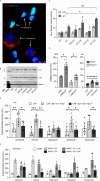
A Dual-immunocytochemical staining for senescence associated beta galactosidase (SAβgal) and the proliferation marker Ki67 in 621-101 cells maintained in low serum cultures over 14 days. Proliferative cells show nuclear Ki67 staining and sparse SAβgal positive lysosomes, whereas senescent cells are large, Ki67 negative, with high levels of SAβgal containing lysosomes. This experiment was repeated 4 times independently with similar results. B Western blot of p21, p16 and loading control, beta actin (βactin) in 621-101 and 621-103 cells (TSC2 addback control), untreated, co-cultured with LAM associated fibroblasts (LAF) or treated with IL-6. MW is molecular weight in kilo Daltons. C Mean (SD) densitometry of western blots of three independent experiments described in panel B (n = 3). Data analysed by 2-way ANOVA. *p < 0.05 (D) Interactions between LAM derived 621 cells (LAM), LAM associated fibroblasts (LAF) and LAM/LAF co-cultures assayed after 14 days (n = 4, 3 replicates). Graphs show mean (SD) percentage of LAM cells (left panel) or LAFs (right panel) expressing SAβgal when interacted in culture. TSC2+/+ are control, addback 621 cells used to show the effect of mTOR dysregulation on the induction of senescence. Data analysed by multiple unpaired t-tests with a false discovery rate of 1% for multiple comparisons. *p < 0.05 and ****p < 0.0001. E Mean (SD) senescence associated beta galactosidase activity in LAFs (n = 4 duplicates) when cultured with 621 cells and the effect of rapamycin and the senolytic drugs Dasatinb and Navitoclax. Data are analysed by multiple unpaired two tailed t tests with a false discovery rate of 1% for multiple comparisons. *p < 0.05 and **p < 0.01, ***p < 0.001. F Mean (SD) senescence associated beta galactosidase activity in A549 epithelial cells when cultured with TSC2-/- 621-101 cells, TSC2+/+ 621-103 cells and LAFs (n = 4 duplicates) in combination and the effect of rapamycin, Dasatinb and Navitoclax. Panels F analysed by 2-way ANOVA. All source data and exact p-values are provided as a Source Data file. *p < 0.05, **p < 0.01, ****p < 0.0001.
Fig. 7
Fig. 7. LAM nodules induce AT2 cell senescence in vitro.
A Experimental setup showing LAM spheroids: 3D cocultures of TSC2-/- or TSC2+/+ LAM derived 621 cells and LAM associated fibroblasts (LAF) cultured in transwells with AT2 cell organoids over 14 days Created in BioRender. Clements, D. (https://BioRender.com/qrl1vu9). B Mean (SEM) AT2 cell organoid area over 14 days co cultured with TSC2-/- 621-101 cells, TSC2+/+ 621-103 cells or LAFs (n = 5 LAF donors, ≥5 replicates). C Mean (SEM) AT2 cell organoid area over 14 days co cultured with TSC2-/- 621-101/LAF or TSC2+/+ 621-103/LAF co-cultures. D Induction of the senescence markers p16 and p21 in AT2 cell organoids over 14 days (n = 5 LAF donors, at least triplicate). E Quantification of mean (SD) p16 and p21 protein in AT2 cell organoids co-cultured with TSC2-/- and TSC2+/+ (n = 4 LAF donors, at least triplicate). LAM spheroids analysed by 2-way ANOVA. Source data and exact p-values are provided as a Source Data file. *p < 0.05 and **p < 0.01, ***p < 0.001, ****p < 0.0001.
Fig. 8
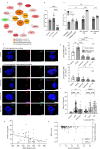
Fig. 8. IL-6 signalling induced by LAM nodules affects wound repair in vitro.
A Upstream regulator analysis of AT2 cell gene induction predicted activation of oestrogen receptor β (ESR2), the interleukin 6 receptor (IL6R), toll like receptor 7 (TLR7), TNF receptor superfamily 1 A (TNFSF1A) and insulin dependent growth factor receptor 1 (IGF1R). B The effect of IL-6 on scratch wound repair in A549 cells. Graphs show mean (SD) percent of wound area healed over 24 h (n = 8, triplicates) analysed by one-way ANOVA. C The effect of IL-6 inhibition using Tocilizumab in scratch assay in A549 cells incubated with conditioned medium (CM) from 3D co-cultures of TSC2-/- 621-101 or TSC2+/+ 621-103, and LAF. Data are mean (SD) (n = 8) analysed using multiple unpaired two-tailed t-tests with 1% FDR correction. Panel C-D Source data and exact p-values are provided (*p < 0.05, **p < 0.01, ***p < 0.001,). D, E Expression of senescence markers p16 and p21 was assessed in AT2 organoids (14-days) culture, either in monoculture or co-culture with 621-101-LAF spheroids, in the presence of rapamycin (10 ng/ml), Tocilizumab (30 ng/ml), or combination therapy. Representative images (D) and quantification (E) show increased expression of senescence markers in LAM spheroid co-culture, attenuated by Tocilizumab and further reduced by combined treatment. Data represent ≥5 organoids in triplicate, analysed by one-way ANOVA. *p < 0.05 and **p < 0.01, ***p < 0.001, ****p < 0.0001. F Serum IL-6 was measured in healthy women (n = 19) and in women with LAM (n = 65), either untreated or treated with rapamycin. Stratification by lung function (FEV1 % predictaed) at the time of sampling analysed by 2-way ANOVA. Source data and exact p-values are provided as a Source Data file. *p < 0.05 and **p < 0.01, ***p < 0.001, ****p < 0.0001. G, H Higher serum IL-6 was associated with reduced six-minute walk (6 MW) distance (n = 56, p = 0.0067) and with more rapid decline in FEV1 and DLCO in LAM patients (n = 88). Linear regression analyses confirmed significant associations. Source data and exact p-values are provided in the source data file (**p < 0.01, ***p < 0.001, ****p < 0.0001).
Fig. 9
Fig. 9. Summary of cell-cell interactions leading to lung repair failure in LAM.
1 LAM cells secrete proteases causing lung injury. Simultaneously, mTOR dysregulated LAM cells secrete IL-6 inducing AT2 cell senescence and impairing lung repair. 2 Lung injury induces alveolar type 2 cell (AT2) differentiation to alveolar type 1 cell (AT1) via intermediate prealveolar type-1 transitional cell state (PATS). 3 As the disease progresses, LAM cells recruit LAM associated fibroblasts to LAM nodules and induce LAF senescence. 4 In later disease, senescent LAFs induce LAM cell senescence and amplify AT2 cell senescence increasing tissue damage, Created in BioRender. Clements, D. (https://BioRender.com/6bdk7z6).

References

    1. McCarthy, C. et al. Lymphangioleiomyomatosis: pathogenesis, clinical features, diagnosis, and management. Lancet Respir. Med.10.1016/s2213-2600(21)00228-9 (2021). - PubMed
    1. Seibert, D. et al. Recognition of tuberous sclerosis in adult women: delayed presentation with life-threatening consequences. Ann. Intern. Med.154, 806–813 (2011). - PMC - PubMed
    1. Clements, D. et al. Wild type mesenchymal cells contribute to the lung pathology of lymphangioleiomyomatosis. PLoS ONE10.1371/journal.pone.0126025 (2015). - PMC - PubMed
    1. Kumasaka, T. et al. Lymphangiogenesis in Lymphangioleiomyomatosis: Its Implication in the Progression of Lymphangioleiomyomatosis. Am. J. Surg. Pathol.28, 1007–1016 (2004). - PubMed
    1. Liu, H. J. et al. TSC2-deficient tumors have evidence of T cell exhaustion and respond to anti-PD-1/anti-CTLA-4 immunotherapy. JCI insight; 3 10.1172/jci.insight.98674 (2018). - PMC - PubMed

MeSH terms

LinkOut - more resources