. 2025 Oct 9;16(1):8994.
doi: 10.1038/s41467-025-64033-6.

Terahertz-field activation of polar skyrons

Affiliations

Terahertz-field activation of polar skyrons

Huaiyu Hugo Wang et al. Nat Commun. .

Abstract

Unraveling collective modes arising from coupled degrees of freedom is crucial for understanding complex interactions in solids and developing new functionalities. Unique collective behaviors emerge when two degrees of freedom, ordered on distinct length scales, interact. Polar skyrmions, three-dimensional electric polarization textures in ferroelectric superlattices, disrupt the lattice continuity at the nanometer scale with nontrivial topology, leading to previously unexplored collective modes. Here, using terahertz-field excitation and femtosecond x-ray diffraction, we discover subterahertz collective modes, dubbed "skyrons", which appear as swirling patterns of atomic displacements functioning as atomic-scale gearsets. The key to activating skyrons is the use of the THz field that couples primarily to skyrmion domain walls. Momentum-resolved time-domain measurements of diffuse scattering reveal an avoided crossing in the dispersion relation of skyrons. Atomistic simulations and dynamical phase-field modeling provide microscopic insights into the three-dimensional crystallographic and polarization dynamics. The amplitude and dispersion of skyrons are demonstrated to be controlled by sample temperature and electric-field bias. The discovery of skyrons and their coupling with terahertz fields opens avenues for ultrafast control of topological polar structures.


Conflict of interest statement

Competing interests: The authors declare no competing interests.

Figures

Fig. 1
Fig. 1. Probing dynamics of polar skyrmions by intense THz excitation and femtosecond X-ray diffraction.
a Experimental setup of THz pump X-ray diffraction probe experiment using an X-ray free-electron laser (FEL). A zoom-in view of the bubbles in the [(PbTiO3)16/(SrTiO3)16]8 SL shows the structure of a polar skyrmion, with the red and blue arrows representing up and down polarizations, respectively. b Illustration of the reciprocal space mapping of polar skyrmions with the Qx-Qz’ detector cut overlaid. c Differential detector images near 004 Bragg peak at the representative time delays, showing the change in diffraction intensity (ΔI). The integer number labels the corresponding orders. The green box illustrates the region of interest for time domain analysis.
Fig. 2
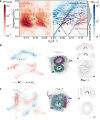
Fig. 2. Dynamics of polar skyrons.
a Region of interest indicated by the rectangular box in Fig. 1c is integrated along the Qz direction near 013 peak. The change of intensity (ΔI) is normalized by the diffraction intensity (I) before time zero is plotted as a function of Qx and the delay. m: the order number of the satellite peaks. ZE: zone edge. b The time-dependent diffraction intensity changes at the selected Qx as indicated by the same color-coded dashed lines in (a). c Fourier spectra of the time-dependent diffraction intensity in (b). The error bar represents the standard deviation of the data points before time zero. The frequencies of modes A and B discussed in the text are indicated by the arrows. d Static polar Skyrmion structure in real space obtained by phase-field simulation and calculated diffraction intensity of the static structure in reciprocal space. e Dynamical phase-field simulation of a snapshot of the perturbed polar skyrmion structure with the maximum polarization change. The arrows indicate polarization vectors of the unit cells. Their colors represent the magnitude of PzΔPx. The right panel shows the corresponding diffraction intensity changes in the reciprocal space. f Schematic of domain and domain wall regions in a polar skyrmion. g Simulated diffraction intensity of the domain walls that mainly contributes to m = ± 2 satellite peaks. h Analytical calculation of dynamical responses that separate the contribution from domain and domain walls at the maximum polarization change (See Supplementary Text 1).
Fig. 3
Fig. 3. Dispersion relation of polar skyrons and their microscopic dynamics.
a Fourier spectra of Fig. 2a (left), compared with the results by the atomistic simulation (right). The color map of the simulation represents the amplitude of the dynamic structure factor S(Qx, ω). Red dots are the overlaid experimental data with the error bars that show the FWHM of the Lorentzian peak fitting of Fourier spectra at each Qx. Two dispersion branches are labeled as A and B mode. The dispersion outside of the THz-pump spectrum shown on the right axis is not experimentally discernible. The dispersions of polariton (P), transverse acoustic (TA) phonons are shown by the dashed lines for comparison. b, c Snapshots of mode A and B at the maximum of the oscillation amplitude, respectively. The left column shows the change of polarization vectors (colored arrows). The middle column shows the schematics of skyrons, in which the dynamic vortices within the skyrmions are represented by the rotating gears. The right column shows the change of Pb displacement in the planes as indicated by labels C1 to C4 in the middle schematics. The thick curved arrows are guide of eye for visualizing the dominant dynamics of the respective regions.
Fig. 4
Fig. 4. Control of polar skyrons by temperature and in-plane electric-field bias.
a Fourier amplitude of the ΔI/I oscillation near the 004 peak measured at the first (green) and second (blue) orders of the skyrmion satellite peaks as a function of temperature. The in-plane DC bias field can reduce the Fourier amplitude, as indicated by the black arrow (data shown in Fig. S8c). The error bar is smaller than the marker size. The dashed line indicate the transition temperature from The skyrmion bubble to labyrinth phase. b Dispersion relation measured near 004 peak at (top) 300 K, and (below) 380 K. The dashed black curves are the guides for the eye. c Phase-field simulation captures a phase transition from a stable bubble phase at 300 K to a vortex-tube-like labyrinth phase at 360 K. The color-map indicates the amplitude of Pz.

References

    1. Girvin, S. M. & Yang, K. Modern Condensed Matter Physics (Cambridge University Press, 2019).
    1. Balents, L., Dean, C. R., Efetov, D. K. & Young, A. F. Superconductivity and strong correlations in moiré flat bands. Nat. Phys.16, 725–733 (2020).
    1. He, F. et al. Moiré patterns in 2d materials: a review. ACS Nano15, 5944–5958 (2021). - PubMed
    1. Adak, P. C., Sinha, S., Agarwal, A. & Deshmukh, M. M. Tunable moiré materials for probing Berry physics and topology. Nat. Rev. Mater.9, 481–498 (2024).
    1. Ramesh, R. & Schlom, D. G. Creating emergent phenomena in oxide superlattices. Nat. Rev. Mater.4, 257–268 (2019).

LinkOut - more resources