. 2025 Oct 9;16(1):8999.
doi: 10.1038/s41467-025-64044-3.

SMC modulates ParB engagement in segregation complexes in streptomyces

Affiliations

SMC modulates ParB engagement in segregation complexes in streptomyces

Katarzyna Pawlikiewicz et al. Nat Commun. .

Abstract

ParB is a bacterial chromosome segregation protein with recently demonstrated CTPase activity. CTP-bound ParB homodimers are loaded onto DNA at parS sites and spread along DNA, forming a large nucleoprotein complex. ParB complexes recruit condensin (SMC protein). Whether SMC modulates ParB complexes has remained unknown. Here, we employ Streptomyces venezuelae strains producing ParB-HaloTag in the presence or absence of SMC and use single-cell time-lapse fluorescence microscopy, single molecule tracking and fluorescence recovery after photobleaching analyses to explore ParB dynamics. Additionally, we perform chromatin immunoprecipitation to examine ParB interactions with DNA, with or without SMC. We reveal that SMC modulates ParB complex stability and ParB mobility. We find that the absence of SMC reduces ParB spreading. Additionally, we show that SMC reduces ParB CTPase activity in vitro. Taken together our data provide evidence of SMC positive feedback on the ParB nucleoprotein complex, offering insight into the nature of ParB complexes.


Conflict of interest statement

Competing interests: The authors declare no competing interests.

Figures

Fig. 1
Fig. 1. ParB-HT complexes in S. venezuelae sporogenic cells are short-lived and disassemble during cell division.
A Representative images from time-lapse analysis of sporogenic development of ΔparB prtetparB-HT ftsZ-ypet (KP011) strain showing fluorescence of ParB-HT stained with Janelia Fluor-549 (red) overlaid with FtsZ-YPet fluorescence (yellow) and phase contrast (grey) (Supplementary Movie 1). Time 0 is the time of sporogenic cell growth arrest, and the analysed stages of sporulation are indicated in the bar scheme below. Scale bar – 1 μm. For separate channels, see Supplementary Fig. 2. B Scheme of the sporogenic cell development indicating the stages which time was measured, the scheme also shows the changes of chromosome compaction, as described before. C Analyses of the time elapsed from growth cessation (time 0) to appearance of regularly spaced ParB-HT complexes (T1), their disappearance (T2), appearance of regularly spaced Z-rings (T3) and their disappearance (T4). Red shading shows the mean lifetime of ParB complexes. Data shown in panel (C) were collected in 3 independent experiments for 35 hyphae. sd - standard deviation. Boxplots show the median value with 1st and 3rd quartiles as box boundaries and whiskers extending to mean +/− 1.5 * IQR. Source data are provided as a Source Data file.
Fig. 2
Fig. 2. The elimination of SMC accelerates disassembly of ParB-HT complexes in S. venezuelae sporogenic hyphae.
A Representative image from time-lapse analysis of sporogenic development of ΔparAB pnatparAB-HT, KP006 strain and ΔsmcΔparAB pnatparAB-HT, KP007 showing fluorescence of ParB-HT stained with Janelia Fluor-549 (red) overlaid with fluorescence of NADA green stained septa (green) and phase contrast (grey) (Supplementary Move 2 and 3). Time 0 is the time of hyphal cell growth arrest. Scale bar – 1 μm. B Scheme of analysed time intervals, the scheme also shows the changes of chromosome compaction, as described before. C Comparison of the time elapsed from growth cessation (time 0) to appearance of regularly spaced ParB-HT complexes (T1), their disappearance (T2), the appearance of septa (NADA signal) (T5) and spores (T6) in the wild type control and Δsmc background (KP006 and KP007). Data shown in panel (C) were collected in 3, or 2 for NADA stained hyphae, independent experiments for 96 hyphae of KP006 strain and 99 hyphae o KP007 strain (to determine T1, T2, T6) and 19 hyphae of KP006 strain and 43 hyphae of KP007 strain (to determine T5), statistical analyses were performed using a two-sided Student’s t test. p-values: T1: 7.479e-12, T2: 2.365e-11, T5: 0.023, T6: 8.957e-08. sd - standard deviation. Boxplots show the median value with 1st and 3rd quartiles as box boundaries and whiskers extending to mean +/− 1.5 * IQR. Source data are provided as a Source Data file.
Fig. 3
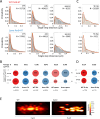
Fig. 3. Mobility of ParB-HT is lowered by the absence of SMC.
A Single-step distance of ParB-HT in sporogenic cells of the wild type control (KP006) and Δsmc strains (KP007) at different stages of sporogenic development. B Percentage of ParB-HT tracks with low (D = 0.02 μm2/s) and high (D = 0.31 μm2/s) diffusion coefficient at different stages of sporogenic development. C Single-step distance of ParB -HT analysis in young vegetative cells (3 µm distance from the tip) of the wild type control (KP006) and Δsmc strains (KP007). D Percentage of ParB-HT tracks with low (D = 0.02 μm2/s) and high (D = 0.34 μm2/s) diffusion coefficient in young vegetative cells (3 µm distance from the tip) of the wild type control (KP006) and Δsmc (KP007) strains. E Heatmap showing a number of tracks with apparent diffusion MSD between 0–0.13 µm2 within 3 μm tip proximal region of young vegetative cells of the wild type control and Δsmc strains. Data shown in (AD) were collected in 2 independent experiments for wild type control and Δsmc strains (ΔparAB pnatparAB-HT, KP006 and ΔsmcΔparAB pnatparAB-HT, KP007, respectively). A, C - Two population model fit and number of analysed steps are shown on each histogram. B, D - Average apparent diffusion coefficient (D) and number of analysed tracks (n) are shown for each strain. Source data are provided as a Source Data file.
Fig. 4
Fig. 4. Elimination of SMC shortens the ParB-HT complex recovery time after photobleaching.
A Representative image showing the photobleaching of the ParB-HT complex stained with Janelia Fluor-549 in young vegetative cells of the wild type control and Δsmc strains (ΔparAB pnatparAB-HT, KP006 and ΔsmcΔparAB pnatparAB-HT KP007, respectively). ParB-HT fluorescence (red) with hyphal cell contour overlaid  (for separate chanells see Supplementary Fig. 9A, Supplementary Movie 6 and 7). B Fluorescence recovery analysis. Intensity of fluorescence plotted against the time of analyses. The dotted lines show mean Tau values for each strain. C Tau – recovery half time - the time required for recovery of half fluorescence intensity calculated for the wild type control and Δsmc strains (ΔparAB pnatparAB-HT, KP006 and ΔsmcΔparAB pnatparAB-HT KP007, respectively). Data shown in B and C were collected in 3 independent experiments for 30 ParB-HT complexes of each strain. Statistical analysis was conducted using a two-sided Wilcoxon test, p-value: 0.036. Boxplots show the median value with 1st and 3rd quartiles as box boundaries and whiskers extending to mean +/− 1.5 * IQR. Source data are provided as a Source Data file.
Fig. 5
Fig. 5. ChIP-seq analyses showing diminished ParB-parS binding and spreading in the absence of SMC.
ChIP seq was performed using antigen-purified polyclonal ParB antibody and wild type, ΔparB (MD020) and Δsmc strain (TM010). A ChIP-seq detected binding plotted against the chromosomal region of S. venezuelae chromosome containing 17 parS sites in wild type (red), Δsmc (blue) and ΔparB (grey) strain. Insets show selected parS sites. B The average ChIP-seq signal at parS sites and neighbouring regions in strain wild type (red), Δsmc (blue) and ΔparB (grey). C Heatmap of 17 parS sites bound by ParB ordered by the number of reads detected at parS site in the wild type strain. D Average number of 100 bp long regions with enriched ParB binding in strains: wild type and Δsmc. Regions were counted using a 10000 bp rolling window. Source data are provided as a Source Data file.
Fig. 6
Fig. 6. SMC complex reduces ParB CTPase activity.
Bar plot mean +/− SD showing the results of CTP hydrolysis assay (phosphate detection) for ParB (2 μM), ParB (2 μM) in the presence of pBSK plasmid with single parS (15 μM), or ParB (2 μM) in the presence of pBSK plasmid with mutated parS (parSmut) (15 μM) in the absence or the presence of FLAG-SMC (0.02 μM), as compared to ParBSMC- (2 μM) variant in the presence of pBSK plasmid with single parS, or in the presence of pBSK plasmid with mutated parS (parSmut), in the absence or in the presence of FLAG-SMC (0.02 μM) (as indicated). Data were obtained from at least 4 independent experimental repeats. A two-sided Student’s t test with Holm correction for multiple testing was used in statistical analysis. p-values: ParB_parS – ParB: 2e-16, ParB_parS – ParB_parS_SMC: 2e-16, ParB_parS_SMC – ParB_SMC: 2.2e-16, ParBSMC-_parS – ParBSMC-_parS_SMC: 0.0097, ParB_parS_SMC - ParBSMC-_parS_SMC: 1, ParB_parS - ParBSMC-_parS: 9.0e-10, ParB_parS_SMC - ParBSMC-_parS: 2.6e-02. Source data are provided in a Source Data file.
Fig. 7
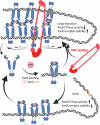
Fig. 7. Positive feedback of SMC loading on ParB complex assembly.
ParB binds parS as the CTP-bound dimer, which is followed by a change in the conformation to the closed clamp that slides away from parS. SMC loaded on the ParB complex extrudes DNA loops promoting ParB interactions that stabilise ParB in a clamp conformation, preventing clamp opening, inorganic phosphate release and ParB dissociation from DNA. ParB interactions on looped DNA stabilise the nucleoprotein complex. In the absence of the SMC ParB clamp, the DNA is destabilised and spreading is limited. Created in BioRender. Wolanski, M. (2025) https://BioRender.com/y0mo9g9.

References

    1. Kawalek, A., Wawrzyniak, P., Bartosik, A. A. & Jagura-Burdzy, G. Rules and exceptions: The role of chromosomal ParB in DNA segregation and other cellular processes. Microorganisms8, 10–12 (2020). - PMC - PubMed
    1. Pióro, M. & Jakimowicz, D. Chromosome segregation proteins as coordinators of cell cycle in response to environmental conditions. Front. Microbiol.11, 588 (2020). - PMC - PubMed
    1. Jalal, A. S. B. & Le, T. B. K. Bacterial chromosome segregation by the ParABS system. Open Biol.10, 10.1098/rsob.200097 (2020). - PMC - PubMed
    1. Ireton, K., Gunther, N. W. & Grossman, A. D. Ireton-JBac1994. J. Bacteriol.176, 5320–5329 (1994). - PMC - PubMed
    1. Breier, A. M. & Grossman, A. D. Whole-genome analysis of the chromosome partitioning and sporulation protein Spo0J (ParB) reveals spreading and origin-distal sites on the Bacillus subtilis chromosome. Mol. Microbiol.64, 703–718 (2007). - PubMed

MeSH terms

Supplementary concepts

LinkOut - more resources