. 2025 Oct 9;16(1):8983.
doi: 10.1038/s41467-025-64050-5.

WEE1 inhibitors synergise with mRNA translation defects via activation of the kinase GCN2

Affiliations

WEE1 inhibitors synergise with mRNA translation defects via activation of the kinase GCN2

Jordan C J Wilson et al. Nat Commun. .

Abstract

Inhibitors of the protein kinase WEE1 have emerged as promising agents for cancer therapy. In this study, we uncover synergistic interactions between WEE1 small-molecule inhibitors and defects in mRNA translation, mediated by activation of the integrated stress response (ISR) through the kinase GCN2. Using a pooled CRISPRi screen, we identify GSPT1 and ALKBH8 as factors whose depletion confer hypersensitivity to the WEE1 inhibitor, AZD1775. We demonstrate that this synergy depends on ISR activation, which is induced by the off-target activity of WEE1 inhibitors. Furthermore, PROTAC-based WEE1 inhibitors and molecular glues show reduced or no ISR activation, suggesting potential strategies to minimise off-target toxicity. Our findings reveal that certain WEE1 inhibitors elicit dual toxicity via ISR activation and genotoxic stress, with ISR activation being independent of WEE1 itself or cell-cycle status. This dual mechanism highlights opportunities for combination therapies, such as pairing WEE1 inhibitors with agents targeting the mRNA translation machinery. This study also underscores the need for more precise WEE1 targeting strategies to mitigate off-target effects, with implications for optimising the therapeutic potential of WEE1 inhibitors.


Conflict of interest statement

Competing interests: S.P.J. is a founding partner of Ahren Innovation Capital LLP, is co-founder of Mission Therapeutics Ltd., and Chief Research Officer (part-time) of Insmed Innovation UK. J.E.C. is a co-founder and SAB member of Serac Biosciences and an SAB member of Mission Therapeutics, Relation Therapeutics, Hornet Bio, and Kano Therapeutics. The remaining authors declare no competing interests.

Figures

Fig. 1
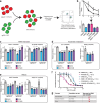
Fig. 1. A pooled CRISPRi screen reveals the perturbation of GSPT1 as a sensitivity hit for WEE1 inhibitors.
a Experimental design of pooled CRISPRi screen b CRISPRi screen results showing NormZ scores, calculated by DrugZ software, at IC95 (x-axis) and IC25 (y-axis) doses of AZD1775. Dosing information is available in Supplementary Fig. 1a. c Representative image of 200 nM AZD1775 and 62.5 nM CC-90009 compounds alone or in combination for 72 h in the RPE TP53−/− cell line in a 6 well plate format followed by quantification of the cell density (independant biological replicates n = 3). Bar charts are depicted with means ± SD, points represent each independant biological replicate. Statistical analysis was performed using one-way ANOVA with multiple comparisons: AZD1775 alone vs. Combination, p < 0.0001; CC-90009 alone vs. Combination, p < 0.0001. d Resazurin cell viability summary synergy scores (combined Loewe, Bliss and HSA synergy scores) of CC-90009 in combination with WEE1 inhibitors (AZD1775, Zn-c3, Debio0123), PKMYT1i (RP-6306), ATRi (AZD6738) or CHEK1i (LY2603618) in RPE TP53−/− cells in a 96 well plate format (independant biological replicates n = 4). Heatmaps of the drug combinations are shown in Supplementary Fig. 4. e Western Blot showing 200 nM AZD1775 and 62.5 nM CC-90009 alone or in combination treated on the RPE TP53−/− cell line for 24 h. Cycloheximide (1 μg/mL) served as a positive control for global mRNA translation shutdown. Cells were treated with puromycin (5 μg/mL, 15 min) before harvesting. The probing of puromycin was run in parallel on a separate blot. A quantification of 3 independant biological repeats of this experiment can be found in Supplementary Fig. 17d–f. f Representative image of HAP1 cells treated with 100 nM AZD1775, 4 μM CC-90009, and 500 nM ISRIB compounds alone or in combination, for 72 h in a 6 well plate format, followed by quantification of the cell density (independant biological replicates n = 3). Bar charts are depicted with means ± SD points represent each independant biological replicate. Statistical analysis was performed using an unpaired two-tailed t-test (combination [AZD1775 + CC-90009] vs. Combination + ISRIB 500 nM), p = 0.0011. Source data are provided as a Source data file.
Fig. 2
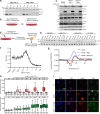
Fig. 2. WEE1 small-molecule inhibitor treatment activates the ISR.
a Western blot of RPE TP53−/− cells treated for 24 h with increasing concentrations of AZD1775, with and without 1 μM GCN2iB. Bands of similar molecular weights were run in parallel on separate blots. Total protein (except for ATF4) served as loading controls. b, c Resazurin-based cell viability assay of RPE-1 TP53−/− dCas9-KRAB cells expressing sgRNAs targeting GCN2, GCN1, or the AAVS1 locus. Cells were treated with varying concentrations of AZD1775 for 72 h in a 96 well plate format (independant biological replicates n = 4). Graphs are depicted with means ± SD. Validations of the CRISPRi knockdown of GCN2 and GCN1 are shown in Supplementary Fig. 9. d Representative immunofluorescence images of a panel of cell lines (RPE-1, U2OS, HAP1, SAOS2, MCF10A, HELA and MEF cell lines) probed for nuclear ATF4 treated with either DMSO, AZD1775 (650 nM for all cell lines except HAP1, which were treated with 300 nM), or AZD1775 in combination with 1 μM GCN2iB followed by row Z-score heatmap normalised per cell line summarising the immunofluorescence nuclear ATF4 intensity across different cell lines (independant biological replicates n = 4). e, f Western blots of two pancreatic ductal adenocarcinoma (PDAC) patient-derived organoids (PDOs) treated with either DMSO, 500 nM AZD1775, or 500 nM AZD1775 + 500 nM ISRIB for 24 h. g Volcano plot of ribosome profiling data showing log2 fold change in ribosome occupancy in RPE-1 TP53–/– cells treated with 650 nM AZD1775 versus DMSO for 10 h (n = 3 independant biological replicates). The x-axis denotes log2 fold change, and the y-axis represents –log10 of the adjusted two-sided p-value. h Summary of flow cytometry based AHA experiment on the RPE-1 TP53−/− cell line. An example of the flow cytometry gating strategy is available in Supplementary Fig. 7a. i Bar chart of flow cytometry results showing the median fluorescence intensity of clickable AHA. RPE-1 TP53−/− cells (6 well plate format) were treated with 1 μg/mL cycloheximide, 350 nM AZD1775, 1.5 μM Debio0123, and 1 μM GCN2iB alone or in combination. A cell population not treated with AHA served as an unstained negative control. Median fluorescence intensity results were normalised to the untreated control (UT) (independant biological replicates n = 3). Bar charts are depicted with means ± SD; points represent each independant biological replicate. Statistical analyses were performed by one-way ANOVA with multiple comparisons, comparing to untreated condition, ns = not significant, **p  <  0.01, ***p  <  0.001, ****p  <  0.0001. Exact p-values are provided in the Source Data. Source data are provided as a Source data file.
Fig. 3
Fig. 3. WEE1 inhibitors synergise via ISR-dependant and ISR-independent mechanisms.
a Schematic showing flow cytometry based CRISPRi two-colour growth competition assays in RPE-1 TP53−/− dCas9-KRAB cells. Cells were transduced with either sgLacZ-mCherry virus or sgGOI (gene of interest)-GFP. The mCherry and GFP expressing cell populations were mixed at a 50:50 ratio and treated with DMSO, AZD1775 (150 nM, 250 nM or 300 nM), 100 nM ISRIB or 1 μM GCN2iB, alone or in combination, for 9 days. Cells were assessed by flow cytometry, passaged and treated with fresh DMSO or drug every 3 days. The flow cytometry gating strategy is available in Supplementary Fig. 7b. b Schematic example of a normalised GFP/mCherry fitness graph. Values above 1 indicate the cell population expressing sgGOI causes increased relative cell fitness compared to cells expressing sgLacZ control, whereas values below 1 indicate decreased fitness. This is followed by an area under the curve that is generated from the GFP/mCherry fitness graph. ce Bar charts quantifying the area under the curve of the normalised GFP/mCherry fitness graphs for different sgGOI-GFP populations vs sgLacZ-mCherry controls. Data were normalised to the respective DMSO-treated conditions. Values > 1 indicate increased relative fitness compared to DMSO. Values < 1 indicate decreased relative fitness compared to DMSO. Grey bars represent DMSO only, blue bars represent AZD1775 treatment only, blue/navy striped bars represent AZD1775 + 100 nM ISRIB, blue/pink striped bars represent AZD1775 + 1 μM GCN2iB. AZD1775 concentrations used: 150 nM for GSPT1, ALKBH8, and PKMYT1 CRISPRi; 250 nM for RRM2 and FZR1 CRISPRi; 300 nM for DUT CRISPRi. Original GFP/mCherry fitness graphs for all conditions (including sgAAVS1-GFP vs sgLacZ-mCherry controls) as well as ISRIB and GCN2iB only treatment controls are provided in Supplementary Figs. 10–13, with CRISPRi knockdown validations in Supplementary Fig. 9. Bar charts are depicted with means ± SD, points represent each biological replicate (independant biological replicates n = 3). Statistical analyses were performed by one-way ANOVA with multiple comparisons, comparing to DMSO treatment, ns = not significant, *p  <  0.05, **p  <  0.01, ***p  <  0.001, ****p  <  0.0001. Exact p-values are provided in the Source Data. f Resazurin-based cell viability assay in RPE TP53−/− cells treated with AZD1775 (varying concentrations) for 72 h, with or without: DMSO, 1 μM PKMYT1i (RP-6306), 100 nM ISRIB, 100 nM ISRIB + 1 μM PKMYT1i, 1 μM GCN1iB and 1 μM GCN1iB + 1 μM PKMYT1i (independant biological replicates n = 3). Graphs are depicted with means ± SD. g Summary table of the different CRISPRi backgrounds tested. Source data are provided as a Source data file.
Fig. 4
Fig. 4. WEE1 inhibitors activate the integrated stress response independent of WEE1 and independent of cell cycle status.
a Western blot showing the time course of WEE1 degradation in the RPE TP53−/− cell line following treatment with 1 μM HRZ-057-1 or HRZ-1-098-1. Data are representative of n = 2 independant biological replicates. b A schematic of the experiment in (c). c Western blot of the RPE TP53−/− cell line pre-treated with DMSO or 1 μM WEE1 molecular glues (HRZ-057-1 and HRZ-1-098-1) for 1 h (total treatment duration: 7 h), followed by DMSO or 650 nM AZD1775 for an additional 6 h. Bands of similar molecular weights were run in parallel on separate blots. Total protein (except for ATF4) served as loading controls. A quantification of three independant biological repeats of this experiment can be found in Supplementary Fig. 17a–c. d A schematic of the in vitro FLAG-tagged GCN2 experiment e Western blot of an in vitro experiment probing the total and phosphorylated GCN2 in the presence of DMSO, Neratinib, WEE1i (AZD1775 and Debio0123), and PKMYT1i (RP-6306). p-GCN2 and total GCN2 were run in parallel on separate blots. A separate, independant biological experiment can be found in Supplementary Fig. 14b. f ADP-Glo assay of GCN2 mixed with a serial dilution of AZD1775 in the presence of ATP in a 384 well plate format (independant biological replicates n = 4). Graphs are depicted with means ± SD. g Thermal unfolding assays of GCN2 in the presence of 200 μM AZD1775 or 100 μM tRNA with a gradient of 0.5 °C/min from 25 °C to 90 °C. Dashed lines connect the negative and positive first derivative F350/F330 peaks to the x-axis. h Immunofluorescence analysis of nuclear ATF4 and γH2AX in the RPE TP53−/− cell line treated with 650 nM AZD1775 across multiple timepoints (independant biological replicates n = 3). Box plots show the median (centre line), the interquartile range (bounds of box), and the minimum and maximum values (whiskers). i Representative images showing ATF4 and γH2AX intensity in untreated (UT) cells and those treated with 650 nM AZD1775 alone or in combination with 1 μM GCN2iB for 24 h in the RPE TP53−/− cell line. Source data are provided as a Source data file.
Fig. 5
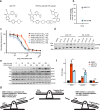
Fig. 5. WEE1 PROTAC elicits less ISR toxicity compared to AZD1775.
a Chemical structure of AZD1775 and PROTACs utilising AZD1775 as a warhead. The chemical structures were adapted on ChemDraw 25.0.2 from a previous publication. b Resazurin cell viability summary synergy scores (combined Loewe, Bliss and HSA synergy scores) of CC-90009 in combination with AZD1775 or ZNL-02-096 in the RPE TP53−/− cell line in a 96 well plate format (independant biological replicates n = 3). Heatmaps of the drug combinations can be found in Supplementary Fig. 16a. c Resazurin cell viability assay with varying concentrations of AZD1775 or ZNL-02-096 treated for 72 h in a 96 well plate format in the RPE-1 TP53−/− dCas9-KRAB cell line expressing sgRNAs that target GCN2 or the AAVS1 locus (independant biological replicates n = 3). Graphs are depicted with means ± SD. d Western blot of an in vitro experiment probing the total and phosphorylated flag-tagged GCN2 in the presence of DMSO, AZD1775 and ZNL-02-096. p-GCN2 and total GCN2 were run in parallel on separate blots. Data are representative of n = 3 independant biological replicates. An additional independant biological experiment can be found in Supplementary Fig. 16b. e Western blot comparing AZD1775 and ZNL-02-096 18 h treatments in the RPE TP53−/− cell line. Data are representative of n = 3 independant biological replicates. f Quantifications of western blots of RPE TP53−/− treated with either DMSO, 650 nM AZD1775 or 650 nM ZNL-02-096 for 18 h (independant biological replicates n = 3). ATF4, γH2AX, and WEE1 were normalised to vinculin loading control. AZD1775 and ZNL-02-096 treatments were normalised to the vehicle to calculate the fold change of each condition. Graphs are depicted with means ± SD. Statistical analysis was performed using unpaired two-tailed t-tests comparing AZD1775 to ZNL-02-096: ATF4, p = 0.01246; γH2AX, p = 0.01331; WEE1, p = 0.00006. g Schematic showing the balance between the two independent toxicities of DNA damage and ISR activation for WEE1 inhibitor treatments. Source data are provided as a Source data file.

References

    1. Featherstone, C. & Russell, P. Fission yeast p107wee1 mitotic inhibitor is a tyrosine/serine kinase. Nature349, 808–811 (1991). - PubMed
    1. Gould, K. L. & Nurse, P. Tyrosine phosphorylation of the fission yeast cdc2+ protein kinase regulates entry into mitosis. Nature342, 39–45 (1989). - PubMed
    1. Lundgren, K. et al. Mik1 and wee1 cooperate in the inhibitory tyrosine phosphorylation of cdc2. Cell64, 1111–1122 (1991). - PubMed
    1. Parker, L. L. & Piwnica-Worms, H. Inactivation of the p34 cdc2 -cyclin B complex by the human WEE1 tyrosine kinase. Science257, 1955–1957 (1992). - PubMed
    1. Li, C., Andrake, M., Dunbrack, R. & Enders, G. H. A bifunctional regulatory element in human somatic wee1 mediates cyclin A/Cdk2 binding and Crm1-dependent nuclear export. Mol. Cell. Biol.30, 116–130 (2010). - PMC - PubMed

MeSH terms

LinkOut - more resources