. 2025;3(10):1152-1167.
doi: 10.1038/s44220-025-00486-4. Epub 2025 Sep 16.

A methylome-wide association study of major depression with out-of-sample case-control classification and trans-ancestry comparison

Xueyi Shen  1 Miruna Barbu  1 Doretta Caramaschi  2 Ryan Arathimos  3 Darina Czamara  4 Friederike S David  5 Anna Dearman  6 Evelyn Dilkes  6 Marisol Herrera-Rivero  7   8 Floris Huider  9 Luise Kühn  10 Kuan-Chen Lu  11 Teemu Palviainen  12 Alicia M Schowe  4   13 Gemma Shireby  14   15 Antoine Weihs  10   16 Chloe C Y Wong  3 Eleanor Davyson  17 Hannah Casey  1 Mark J Adams  1 Antje-Kathrin Allgaier  18 Michael Barber  19 Joe Burrage  20 Avshalom Caspi  3   21 Ricardo Costeira  22 Erin C Dunn  23   24 Lisa Feldmann  25   26 Josef Frank  27 Franz J Freisleder  28 Danni A Gadd  29 Ellen Greimel  25   26 Eilis Hannon  20 Sarah E Harris  30 Georg Homuth  31 David M Howard  3 Stella Iurato  4   32 Tellervo Korhonen  12 Tzu-Pin Lu  33 Nicholas G Martin  34 Jade Martins  35 Edel McDermott  36 Susanne Meinert  37   38 Pau Navarro  19   39 Miina Ollikainen  12   40 Verena Pehl  25 Charlotte Piechaczek  25 Aline D Scherff  25   26 Frederike Stein  41   42 Fabian Streit  27   43   44   45 Alexander Teumer  10   46 Henry Völzke  46   47 Jenny van Dongen  9 Rosie M Walker  2 Natan Yusupov  4   48 Louise Arseneault  3 Jordana T Bell  22 Klaus Berger  8 Elisabeth Binder  4 Dorret I Boomsma  49 Simon R Cox  30 Udo Dannlowski  37 Kathryn L Evans  50 Helen L Fisher  3   51 Andreas J Forstner  5   52   53 Hans J Grabe  10   16 Jaakko Kaprio  12 Tilo Kircher  41   42 Johannes Kopf-Beck  54   55 Meena Kumari  6 Po-Hsiu Kuo  56   57 Qingqin S Li  58 Terrie E Moffitt  3   21 Hugh Mulcahy  36   59 Therese M Murphy  60 Gerd Schulte-Körne  25   26 Jonathan Mill  14   20 Cathryn M Lewis  3 PGC MDD Working GroupNaomi R Wray  61   62 Andrew M McIntosh  1
Collaborators, Affiliations

A methylome-wide association study of major depression with out-of-sample case-control classification and trans-ancestry comparison

Xueyi Shen et al. Nat Ment Health. 2025.

Abstract

Major depression (MD) is a leading cause of global disease burden, and both experimental and population-based studies suggest that differences in DNA methylation may be associated with the condition. However, previous DNA methylation studies have, so far, not been widely replicated, suggesting a need for larger meta-analysis studies. Here we conducted a meta-analysis of methylome-wide association analysis for lifetime MD across 18 studies of 24,754 European-ancestry participants (5,443 MD cases) and an East Asian sample (243 cases, 1,846 controls). We identified 15 CpG sites associated with lifetime MD with methylome-wide significance. The methylation score created using the methylome-wide association analysis summary statistics was significantly associated with MD status in an out-of-sample classification analysis (area under the curve 0.53). Methylation score was also associated with five inflammatory markers, with the strongest association found with tumor necrosis factor beta. Mendelian randomization analysis revealed 23 CpG sites potentially causally linked to MD, with 7 replicated in an independent dataset. Our study provides evidence that variations in DNA methylation are associated with MD, and further evidence supporting involvement of the immune system.

Keywords: DNA methylation; Depression; Epigenomics; Predictive markers.


Conflict of interest statement

Competing interestsQ.S.L. is an employee of Janssen Research & Development, LLC. Q.S.L. owns stock and/or stock options in Johnson & Johnson. H.J.G. has received travel grants and speakers’ honoraria from Indorsia, Neuraxpharm, Servier and Janssen Cilag. T. Kircher received unrestricted educational grants from Servier, Janssen, Recordati, Aristo, Otsuka, neuraxpharm. The remaining authors declare no competing interests.

Figures
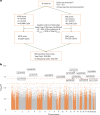
Fig. 1
Fig. 1. Meta-analysis of MWAS for MD.
a, Workflow of meta-analysis. b, Manhattan plot for the meta-analysis of MWAS for MD. Each dot represents a CpG probe. The x axis represents the relative positions of the probes in the genome. The y axis represents −log10-transformed, two-sided P values. The red and yellow dashed lines represent the significance threshold for Bonferroni and FDR correction, respectively.
Fig. 2
Fig. 2. Comparison between basic and complex models.
a,b, In both comparison of effect sizes indicated by standardized coefficients of linear regression (a) and comparison of double-sided P values (b), each dot represents a CpG probe. In a, the x axis represents effect size, and in b, the x axis represents −log10-transformed, double-sided P value. Error bars represent ± one standard error of the mean. Differences in P values reflect both the model used and the sample sizes. The y axis represents individual CpG sites. The yellow dashed line in b represents the significance threshold for nominal significance (double-sided P < 0.05).
Fig. 3
Fig. 3. Out-of-sample classification of MD using MS.
a, Box plot for case–control classification using MS created using P-value threshold at 5 × 10−8. MS was standardized and residualized against age, sex and values for aryl hydrocarbon receptor repressor (AHRR) probes. Residuals of MSs were used for the plot. The x axis represents MS, and the y axis represents MD case and control groups. Box boundaries are determined by the top and bottom quartiles. Box whiskers are defined by 1.5 interquartile range. Any values outside of the box whiskers are presented as individual data points. Median values per group are indicated as vertical lines within the boxes. b, Statistics for MS association tests. Cohen’s d was calculated by comparing MD case–control differences in MS. Double-sided P values are reported. PT, P threshold for creating the MS.
Fig. 4
Fig. 4. MR analysis of the causal effect of DNAm on MD.
a, P plot for discovery MR analysis in GS. Each dot represents a CpG site. The x axis represents chromosomes and base pair position. The y axis represents −log10-tranformed P value of Wald ratio MR analysis. The gray dashed line shows the FDR-corrected significance threshold. Discovery MR analysis was performed on CpG sites available in the EPIC array. b, Replication analysis in GoDMC for the significant CpGs found in the discovery analysis. Replication analysis was performed on CpG sites available on the 450K array. Of the 23 significant CpG sites in the discovery analysis, 19 were available on both EPIC and 450K arrays and therefore were included in the replication analysis. The x axes represent effect size and −log10-transformed P value on the left and right panels. The y axis represents individual CpG sites. The yellow dashed line in the right panel represents FDR-significance threshold.

References

    1. Sullivan, P. F., Neile, M. C. & Kendler, K. S. Genetic epidemiology of major depression: review and meta-analysis. Am. J. Psychiatry157, 1552–1562 (2000). - PubMed
    1. McIntosh, A. M., Sullivan, P. F. & Lewis, C. M. Uncovering the genetic architecture of major depression. Neuron102, 91–103 (2019). - PMC - PubMed
    1. Howard, D. M. et al. Genome-wide meta-analysis of depression identifies 102 independent variants and highlights the importance of the prefrontal brain regions. Nat. Neurosci.22, 343–352 (2019). - PMC - PubMed
    1. Pettersson, E. et al. Genetic influences on eight psychiatric disorders based on family data of 4,408,646 full and half-siblings, and genetic data of 333,748 cases and controls. Psychol. Med.49, 1166–1173 (2019). - PMC - PubMed
    1. Zeng, Y. et al. Parent of origin genetic effects on methylation in humans are common and influence complex trait variation. Nat. Commun.10, 1383 (2019). - PMC - PubMed

LinkOut - more resources