. 2025 Dec;32(6):343.
doi: 10.3892/mmr.2025.13708. Epub 2025 Oct 10.

Glioma‑associated microglia and macrophages as a potential target for mTOR inhibition in glioblastoma

Affiliations

Glioma‑associated microglia and macrophages as a potential target for mTOR inhibition in glioblastoma

Pia S Zeiner et al. Mol Med Rep. 2025 Dec.

Abstract

Glioma‑associated microglia/macrophages (GAM) constitute the predominant immune cell population in glioblastoma (GB). Both GB cells and GAM exhibit upregulated mTOR signaling. The present study aimed to investigate the effects of pharmacological mTOR inhibition (mTORi) specifically on GAM. The effects of mTORi on signal transduction, cell growth and viability were analyzed in immortalized microglia cell lines. Additionally, a comprehensive analysis of the GAM phenotype was conducted, including whole transcriptome analyses and cytokine profiling. Effects were investigated in a tumor cell/GAM co‑culture model under mTORi with rapamycin or torin2 or treatment with temozolomide, the standard chemotherapy agent for patients with GB. In the in vitro model, mTORi had significant effects on central biological functions of GAM, resulting in reduced proliferation and oxygen consumption. Additionally, treatment with mTORi induced a pro‑inflammatory phenotype in microglia cell lines. These findings demonstrate the relevance of mTOR signaling on GAM biology. Moreover, they provide rationales for therapeutic interventions targeting mTOR signaling specifically in GAM as a potential novel treatment strategy.

Keywords: glioma; mTOR; microglia; rapamycin; tumor microenvironment.


Conflict of interest statement

JPS has received honoraria for lectures, advisory board participation, consulting or travel grants from Abbvie, Roche, Boehringer, Bristol-Myers Squibb, Medac, Mundipharma, Servier and UCB. MHM is meanwhile an employee of Sanofi. MWR has received a research grant from UCB as well as honoraria for advisory board participation from Alexion and Servier. PSZ, MS, JS, NIL, JBW, BS, BR, KJW, ALL, AB, KHP, LS and PNH report no disclosures relevant to the manuscript.

Figures
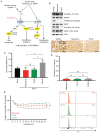
Figure 1. Impact of pharmacological mTOR inhibition on basal functions of human microglia cell lines. (A) Overview of the mTOR pathway and targets of the mTOR inhibitors investigated in this study. Sc...
Figure 1.
Impact of pharmacological mTOR inhibition on basal functions of human microglia cell lines. (A) Overview of the mTOR pathway and targets of the mTOR inhibitors investigated in this study. Scheme adapted from (33). (B) C20 cells were incubated with 100 nM rapamycin, 100 nM torin2 and vehicle control for 24 h. Protein lysates were analyzed by immunoblotting with antibodies for NDRG1, P-NDRG1 (Thr346), S6RP, P-S6RP (Ser240/244), 4E-BP1, P-4E-BP1 (Thr37/46) and actin as well as by immunocytochemistry stainings of P-4E-BP1 (scale bar, 100 µm) of C20 cell pellets incubated with 100 nM rapamycin, 100 nM torin2 and vehicle control for 24 h. (C-E) C20 microglia cells were treated with 100 nM rapamycin (red), 100 nM, torin2 (green) or vehicle control (grey). (C) Crystal violet staining was used to quantify cell density at baseline (day 0, after a 24 h attachment period prior to any treatment intervention, black) and after 72 h of exposure to the respective treatment conditions. Data are presented as mean ± SD (n=4; one-way ANOVA, Tukey's multiple comparisons test). (D) Cell death was quantified by PI FACS after 72 h. Data represent mean ± SD (n=3; one-way ANOVA, Tukey's multiple comparisons test). Histograms were depicted. (E) Quantification of oxygen by a fluorescence-based assay was performed in C20 cells during 24 h treatment. Oxygen consumption is shown relative to the start of the experiment as mean (n=3) every hour; treatment groups were then compared at timepoint 24 h (n=3; one-way ANOVA, Tukey's multiple comparisons test). *P<0.05, **P<0.01 and ***P<0.001. ns, not significant; PI, propidium iodide; SD, standard deviation; NDRG1, N-myc downstream-regulated gene 1; P-, phosphorylated; S6RP, S6 ribosomal protein; 4E-BP1, 4E-binding protein 1.
Figure 2. Impact of rapamycin compared with temozolomide on the GAM transcriptome. (A) Overview on all treatment conditions used throughout the experimental setup (created in BioRender, Strecker, M. ....
Figure 2.
Impact of rapamycin compared with temozolomide on the GAM transcriptome. (A) Overview on all treatment conditions used throughout the experimental setup (created in BioRender, Strecker, M. (2025); http://BioRender.com/wgg6ezp). Temozolomide effects were only analyzed by RNA sequencing (transcriptome), torin2 co-culture experiments were only analyzed in the cytokine assay. (B) Gene expression was analyzed in the whole transcriptome dataset by PCA across all C20 samples including triplicates of the different treatments (rapamycin, temozolomide and vehicle control) in the co-culture (C20 microglia with LNT-229 glioma cells) or the C20 mono-culture condition (bright colors, GAM co-culture of C20 with LNT-229; light colors, MG mono-culture control condition; red, treatment with 100 nM rapamycin; blue, 400 µM temozolomide; grey, vehicle control) (biological replicates were labelled 1 to 3). PCA, principal component analysis; GAM, glioma-associated microglia/macrophages; MG, microglia.
Figure 3. Differential expression of genes in GAM following rapamycin and temozolomide treatment. Heatmap depicts hierarchical clustering of the top 100 PCA gene loadings in C20 GAM (co–cultivated) or...
Figure 3.
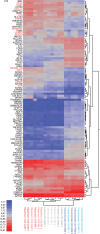
Differential expression of genes in GAM following rapamycin and temozolomide treatment. Heatmap depicts hierarchical clustering of the top 100 PCA gene loadings in C20 GAM (co-cultivated) or C20 MG (C20 monoculture control condition) following pharmacological mTORi with 100 nM rapamycin versus vehicle control or treatment with 400 µM temozolomide versus vehicle control. Variance-stabilized transformed data values are shown. Genes involved in inflammatory processes were highlighted in red. GAM, glioma-associated microglia/macrophages; PCA, principal component analysis; MG, microglia; mTORi, mTOR inhibition.
Figure 4. Impact of rapamycin and temozolomide on key gene programs in GAM. Gene set enrichment analysis was performed to decipher gene programs most relevant to the respective culture and treatment c...
Figure 4.
Impact of rapamycin and temozolomide on key gene programs in GAM. Gene set enrichment analysis was performed to decipher gene programs most relevant to the respective culture and treatment conditions. Heatmap of normalized enrichment score of the hallmark gene sets (v7.4) in C20 GAM (co-cultivated) or C20 MG (C20 monoculture control condition) following pharmacological mTORi with 100 nM rapamycin versus vehicle control or treatment with 400 µM temozolomide versus vehicle control. Normalized enrichment scores are shown. A significance level of *P<0.05 was depicted. Hallmark gene sets involved in key immunogenic pathways were highlighted in red and for mTORC1 signaling in green. Hallmark gene sets displaying the same regulation pattern under rapamycin in C20 and HMC3 (Fig. S6) were highlighted with squares. GAM, glioma-associated microglia/macrophages; MG, microglia; mTORC1, mTOR complex 1; mTORi, mTOR inhibition.
Figure 5. Impact of pharmacological mTOR inhibition on cytokine expression profiles of GAM. (A) Immunodetection of 36 different cytokines (each in duplicate) per pooled sample (pool of n=3) incubated ...
Figure 5.
Impact of pharmacological mTOR inhibition on cytokine expression profiles of GAM. (A) Immunodetection of 36 different cytokines (each in duplicate) per pooled sample (pool of n=3) incubated with rapamycin, torin2 or vehicle. (B) Quantification by relative mean spot pixel density for each cytokine was depicted. (A and B) Bright colors, GAM co-culture of C20 with LNT-229; light colors, MG mono-culture control condition; red, treatment with 100 nM rapamycin; green, 100 nM torin2; grey, vehicle control. (C) Overview of protein expression in the treatment conditions rapamycin and torin2 compared to vehicle control in C20 GAM and C20 MG, respectively. Green, increased; grey, similar; red, decreased; no color, not analyzable/detectable. GAM, glioma-associated microglia/macrophages; MG, microglia.

References

    1. Capper D, Jones DTW, Sill M, Hovestadt V, Schrimpf D, Sturm D, Koelsche C, Sahm F, Chavez L, Reuss DE, et al. DNA methylation-based classification of central nervous system tumours. Nature. 2018;555:469–474. doi: 10.1038/nature26000. - DOI - PMC - PubMed
    1. Mandel JJ, Yust-Katz S, Patel AJ, Cachia D, Liu D, Park M, Yuan Y, Kent TA, de Groot JF. Inability of positive phase II clinical trials of investigational treatments to subsequently predict positive phase III clinical trials in glioblastoma. Neuro Oncol. 2018;20:113–122. doi: 10.1093/neuonc/nox144. - DOI - PMC - PubMed
    1. Ronellenfitsch MW, Steinbach JP, Wick W. Epidermal growth factor receptor and mammalian target of rapamycin as therapeutic targets in malignant glioma: Current clinical status and perspectives. Target Oncol. 2010;5:183–191. doi: 10.1007/s11523-010-0154-5. - DOI - PubMed
    1. Stupp R, Mason WP, van Den Bent MJ, Weller M, Fisher B, Taphoorn MJ, Belanger K, Brandes AA, Marosi C, Bogdahn U, et al. Radiotherapy plus concomitant and adjuvant temozolomide for glioblastoma. New Engl J Med. 2005;352:987–996. doi: 10.1056/NEJMoa043330. - DOI - PubMed
    1. Bowman RL, Klemm F, Akkari L, Pyonteck SM, Sevenich L, Quail DF, Dhara S, Simpson K, Gardner EE, Iacobuzio-Donahue CA, et al. Macrophage ontogeny underlies differences in tumor-specific education in brain malignancies. Cell Rep. 2016;17:2445–2459. doi: 10.1016/j.celrep.2016.10.052. - DOI - PMC - PubMed

MeSH terms