. 2025 Nov 1;32(Pt 6):1479-1490.
doi: 10.1107/S160057752500774X. Epub 2025 Oct 10.

High magnification optical imaging systems for the characterization of soft X-ray focii

Affiliations

High magnification optical imaging systems for the characterization of soft X-ray focii

Andre Al Haddad et al. J Synchrotron Radiat. .

Abstract

We present a series of novel X-ray imaging systems designed specifically for the soft X-ray energy range, optimized for operation in ultra-high-vacuum environments and compactness. These systems achieve micrometre-level spatial resolution with high collection efficiency of visible light by using high numerical aperture optics. Comprehensive characterization of the systems' response was performed, including linearity assessments and X-ray sensitivity measurements, across X-ray photon densities ranging from 1 nJ m-2 to 10-4 nJ m-2. The imaging system was employed for caustic measurements to characterize the X-ray focal spot and to demonstrate its capabilities. Finally, grating interferometry was used to measure the wavefront distortion, yielding a pitch resolution as fine as 3.1 µm. These results underscore the system's potential for high-resolution soft X-ray imaging and wavefront characterization applications.

Keywords: Talbot imaging; focus characterization; imaging; micrometric resolution; soft X-rays.


Figures

Figure 1
Figure 1
CAD-model of the imaging system, featuring an off-the-shelf objective, XYZ motion for precise scintillator positioning, and a mirror that directs the image (in yellow) outside the vacuum chamber. A field lens and camera are placed outside the vacuum to capture the image. The in-vacuum assembly is mounted on a movable stage, enabling quick insertion or removal from the beam path.
Figure 2
Figure 2
CAD-drawing of a compact imaging system utilizing a reflective objective. (a) Top view showing the incoming X-ray beam (in red), the scintillator, the reflective microscope, and a mirror directing the image outside the chamber. A linear motion stage aligns the scintillator at the focal plane of the objective. (b) 3D view of the system mounted on a three-axis manipulator. The image travels through the manipulator and exits via a window, where a field lens and camera are positioned. The manipulator enables precise placement of the entire system at the X-ray interaction point and allows for its removal to accommodate the main experiments.
Figure 3
Figure 3
(a) An exploded view showing the individual components. The scintillator screen is housed in the threaded tube (4) and fixed in position using the clamp and spring (1, 2). The threaded tube (4) is then mounted into the front casing (6) and locked in position. By rotating (4), the distance of the scintillator relative to the casing and lens could be adjusted and locked. The aspheric lens is clamped between two metal rings and pushed towards the front casing by a spring (6, 7). The rear casing (10) holds the system together under stress. The alignment set screws (11) allow the adjustment of the lens angle and position relative to the scintillator screen. Panels (b) and (c) show photographs of the assembled system with a ruler for reference.
Figure 4
Figure 4
(a) Three diffraction patterns at 20 µm step in the lateral position of the imaging system relative to the X-ray beam. The white line is the projection along the vertical axis. (b) The diffraction pattern projection aligned at the lateral scan’s central peak from −40 µm to 40 µm with 20 µm step.
Figure 5
Figure 5
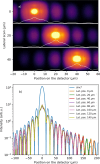
Panels (a) and (c) show diffraction patterns from 1 keV and 0.6 keV, respectively. The horizontal diffraction orders were used to calculate the system’s response, labeled in white in the image. Panels (b) and (d) show the image intensity versus local pulse energy density in the image. Positive and negative orders are labeled using a * and + markers, respectively.
Figure 6
Figure 6
Intensity dependence of various diffraction orders to the photon energy around the O 1s absorption edge. Central peak and ±1 orders show dependence on the absorption edge, contrary to the other orders. Error bars represent standard error.
Figure 7
Figure 7
Optimizing the focal spot with the help of the bender motors B1 and B2. The beamlets are defined by the aperture indicated by green arrows and hit the mirror in the center (black) and its front (red) and rear (blue) parts.
Figure 8
Figure 8
(Top) Focal image along the X and Y axis over a caustic scan along the X-ray propagation direction. The dots represent single-image acquisitions, and solid lines are based on Gaussian beam propagation in focus. (Bottom) Image of the X-ray focal spot at four different Z positions with projections of the beam intensity along the X and Y axes.
Figure 9
Figure 9
Images of two-color X-ray beams at the focus. (a) Color 1 at 540 eV photon energy generated in the first section of the undulators. (b) Color 2 at 520 eV photon energy generated in the second section of the undulators. (c) Both colors combined.
Figure 10
Figure 10
(a) Image generated by a single X-ray pulse using a 2 µm pitch grating. (b) The real part of the Fourier-filtered image is extracted, and the self-image of the grating is observed. (c) Phase of the image oscillatory pattern across the image with linear contribution removed. The color map represents the phase in radians.
Figure 11
Figure 11
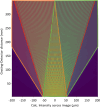
Wavefront propagation was simulated while incorporating experimental conditions. The fundamental, +1 and −1 diffraction order beams are outlined in red, green and orange, respectively. The central triangular region contains the Talbot carpet, which exhibits the Talbot self-imaging effect modulated along the optical axis. The interference patterns observed outside the Talbot carpet remain consistent and arise from the interaction between the fundamental beam and one of the diffraction orders.
Figure 12
Figure 12
Fourier-filtered spectral interference patterns were measured at grating–detector distances of 178 mm and 184 mm. At 178 mm, the interference pattern appears split around the image center, indicating a position outside the Talbot plane. At 184 mm, corresponding to Talbot order 33, a central interference pattern is observed, with symmetric interference features surrounding it.
Figure 13
Figure 13
The blue curve represents the focus size determined through back-propagation using the measured phase and amplitude of the incoming X-ray beam. The orange curve depicts the vertical projection of the X-ray beam footprint measured at the focus position. The inset displays the beam footprint measured at the focus.
Figure 14
Figure 14
Fourier transforms of the images at three distinct beam focal points. The grating–detector distance was fixed to 15 cm, while the focus was moved along the optical axis to 12.5, 16 and 17.8 cm away from the grating.
Figure 15
Figure 15
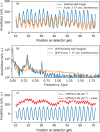
(a) A line-out over a width of 16.5 µm from the image in Fig. 10 ▸(a) is taken in the Talbot grating self-image area, and out of it. (b) A Fourier transform of both line-outs is presented. (c) The real part of the inverse Fourier transform of the low-frequency component at 3.13 µm−1 is presented in blue. The red curve is the residual between the low-frequency component and the measured line-out at the Talbot self-image.

References

    1. Abela, R., Alarcon, A., Alex, J., Arrell, C., Arsov, V., Bettoni, S., Bopp, M., Bostedt, C., Braun, H.-H., Calvi, M., Celcer, T., Craievich, P., Dax, A., Dijkstal, P., Dordevic, S., Ferrari, E., Flechsig, U., Follath, R., Frei, F., Gaiffi, N., Geng, Z., Gough, C., Hiller, N., Hunziker, S., Huppert, M., Ischebeck, R., Jöhri, H., Juranic, P., Kalt, R., Kaiser, M., Keil, B., Kittel, C., Künzi, R., Lippuner, T., Löhl, F., Marcellini, F., Marinkovic, G., Ozkan Loch, C., Orlandi, G. L., Patterson, B., Pradervand, C., Paraliev, M., Pedrozzi, M., Prat, E., Ranitovic, P., Reiche, S., Rosenberg, C., Sanfilippo, S., Schietinger, T., Schmidt, T., Schnorr, K., Svetina, C., Trisorio, A., Vicario, C., Voulot, D., Wagner, U., Wörner, H. J., Zandonella, A., Patthey, L. & Ganter, R. (2019). J. Synchrotron Rad.26, 1073–1084.
    1. Alaruri, S. D. (2018). Int. J. Meas. Technol. Instrum. Eng.7, 17–37.
    1. Baumann, T. M., Boll, R., De Fanis, A., Grychtol, P., Ilchen, M., Jastrow, U. F., Kato, M., Lechner, C., Maltezopoulos, T., Mazza, T., Montaño, J., Music, V., Ovcharenko, Y., Rennhack, N., Rivas, D. E., Saito, N., Schmidt, P., Serkez, S., Sorokin, A., Usenko, S., Yan, J., Geloni, G., Tanaka, T., Tiedtke, K. & Meyer, M. (2023). J. Synchrotron Rad.30, 662–670. - PMC - PubMed
    1. Born, M. & Wolf, E. (1999). Principles of Optics. Cambridge University Press.
    1. Follath, R., Flechsig, U., Wagner, U. & Patthey, L. (2019). Proceedings of the 39th International Free Electron Laser Conference (FEL2019), 26–30 August 2019, Hamburg, Germany, pp. 535–537.

LinkOut - more resources