. 2025 Oct 10;11(41):eads2905.
doi: 10.1126/sciadv.ads2905. Epub 2025 Oct 10.

Functional recovery of islet β cells in human type 2 diabetes: Transcriptome signatures unveil therapeutic approaches

Affiliations

Functional recovery of islet β cells in human type 2 diabetes: Transcriptome signatures unveil therapeutic approaches

Mara Suleiman et al. Sci Adv. .

Abstract

Remission of type 2 diabetes (T2D) can occur after hypocaloric diet, bariatric surgery, or pharmacological treatments and associates with improved β cell function. Here, we studied islets from nondiabetic (n = 15) and T2D (n = 21) donors. We examined whether T2D β cell dysfunction can be rescued, charted the underlying molecular mechanisms by RNA sequencing, and mined transcriptomes for drug targets. Glucose responsiveness of T2D β cells improved in 60% of preparations after 3-day culture in euglycemic conditions. This was accompanied by changes in expression of >400 genes involved in functional or inflammatory pathways. Drug repurposing and target identification analyses predicted chemical and genetic hits, including JAK inhibitors, which were validated in a β cell line, human islets, and db/db mice. Therefore, defective β cell glucose responsiveness in T2D can recover, demonstrating β cell functional plasticity. The recovery associates with transcriptomic traits, pointing to targetable defects to induce T2D remission.


Figures
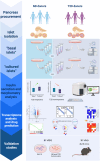
Fig. 1.
Fig. 1.. Experimental design.
Islets were isolated from the pancreas of ND and T2D donors and then cultured for 2 days in plain culture medium (containing 5.5 mM glucose) to allow recovery from the isolation stress. Islets were then evaluated in terms of GSIS and (for T2D islets) transcriptome features (basal). Afterward, ND and T2D islets were cultured for ~3 days at 5.5 (nrmoglycemia) and (for a subgroup of T2D islets) also at 11.1 (moderate hyperglycemia”) mM glucose, followed by GSIS and transcriptome analysis (T2D islets only). Based on changes in GSIS between cultured versus basal assessments, T2D islets were classified as improvers or nonimprovers. Transcriptomes of improver and nonimprover T2D islets were compared, differential signatures used to identify potential therapeutic targets, and validation studies performed by in vitro and in vivo experiments. Refer to text for further details. Created in BioRender [Suleiman, M. (2025); https://BioRender.com/32jzgsb.
Fig. 2.
Fig. 2.. Insulin secretion in response to glucose from ND and T2D islets.
(A) ISIs from ND and T2D islets before (basal) and after (cultured) culture at 5.5 mM glucose. (B) Insulin release in response to 3.3 and 16.7 mM glucose from ND and T2D islets before (basal) and after (cultured) 3-day culture at 5.5 mM glucose. (C) ISI of cultured islets relative to basal values; the ratio was used to define 13 improver (magenta) and 8 nonimprover (gray) T2D islet preparations; ND islets are indicated in blue. (D) ISI fold changes relative to basal in the three groups (T2D improvers, T2D nonimprovers, and ND), confirming that improvers had better β cell glucose responsiveness after culture, with no difference between nonimprovers and ND. (E) ISI of improver and nonimprover islet preparations (basal and cultured). (F) Insulin release in response to 3.3 and 16.7 mM glucose from improver and nonimprover T2D islets before (basal) and after 3-day culture at 5.5 mM glucose. Statistical analysis was performed by two-way analysis of variance (ANOVA). *P < 0.05, **P < 0.01, ***P < 0.001, and ****P < 0.0001.
Fig. 3.
Fig. 3.. Transcriptomes of improver and nonimprover T2D islets.
(A and B) DEGs in volcano plots showing the difference of fold change and significance between cultured and basal islets for (A) improvers and (B) nonimprovers. The red line marks the 0.05 FDR significance threshold. (C to F) Overlapping DEGs between improvers and nonimprovers. The Venn diagrams show the number of DEGs either shared or unique to improvers or nonimprovers. The comparisons include genes regulated in the same (C and F) or opposite directions (D and E).
Fig. 4.
Fig. 4.. Enriched pathways and gene expression changes in cultured T2D islets.
(A and B) Most significantly enriched functional pathways in the improver cultured versus basal islets. The bar plots show significance and normalized enrichment scores of the 20 most significantly enriched Gene Ontology terms [Biological Pathway (BP)] in negative (A) or positive (B) direction. (C and D) Most significant correlations between gene expression and insulin secretion changes (cultured versus basal) shown as scatterplots. The eight genes with the most significant positive (C) and negative (D) correlations are shown.
Fig. 5.
Fig. 5.. Identification of potential therapeutic targets through mining of differential signatures.
The top 150 up-regulated (A and C) and top 150 down-regulated (B and D) genes were analyzed in the Connectivity Map to identify chemical (A and B) and genetic perturbagens (C and D). Genetic targets identified in Connectivity Map were crossmatched with genes negatively correlated with GSIS. Genes modulated in nonimprovers were excluded from these analyses. Signatures generated by knocking down genes are positively correlated with the improvers and were considered as potential targets. Only classes with a |median tau score| >80 were considered as potential chemical perturbations. The genetic targets also identified in the iLINCs database are marked with an asterisk. KD, knockdown.
Fig. 6.
Fig. 6.. Baricitinib improves β cell function in T2D but not in ND islets.
(A) ND (circle, six donors) or T2D (square, six donors) islets were treated with 4 μM baricitinib (red) or DMSO (white), and insulin secretion was assessed at 1.6 and 16.8 mM glucose. (B) Data from (A) presented as ISI. (C) Expression levels of TNNI2 and IL24 by RNA-seq of T2D islets (four donors) treated or not with baricitinib. Counts normalized by DESeq2 median of ratios method. (D) β cell IFN-stimulated gene (ISG) score was computed on the basis of single-cell RNA-seq data from 8 T2D and 13 matched ND donors or 10 T1D and 14 matched ND donors from the HPAP (see text for details). Boxes depict the 25th and 75th percentiles, and the line represents the median. Statistical significance was determined using paired or unpaired two-tailed t test. *P < 0.05, **P < 0.01, and ****P < 0.0001.
Fig. 7.
Fig. 7.. Baricitinib partially preserves insulin secretion in db/db mice.
(A) Weight, expressed as fold change relative to baseline (week 0) in baricitinib (orange) treated db/db mice as compared to vehicle (blue). (B) Glucose levels during OGTT basally and after 4 weeks of treatment with baricitinib or vehicle. (C) Glucose area under the curve (AUC) during OGTT before (week 0) and after 4 weeks (week 4) of treatment with baricitinib or vehicle. (D) Insulin levels during OGTT. (E) OGTT insulin AUC before and after 4-week treatment with baricitinib or vehicle. (F) Decline in insulin AUC over 4 weeks, expressed as percent decreased value relative to week 0. Statistical analysis between baricitinib- and vehicle-treated groups at the same time point was performed by unpaired two-tailed t test or two-way ANOVA with Sidak correction for multiple comparisons. *P < 0.05 and **P < 0.01.

References

    1. Ahmad E., Lim S., Lamptey R., Webb D. R., Davies M. J., Type 2 diabetes. Lancet 400, 1803–1820 (2022). - PubMed
    1. Alonso L., Piron A., Morán I., Guindo-Martínez M., Bonàs-Guarch S., Atla G., Miguel-Escalada I., Royo R., Puiggròs M., Garcia-Hurtado X., Suleiman M., Marselli L., Esguerra J. L. S., Turatsinze J.-V., Torres J. M., Nylander V., Chen J., Eliasson L., Defrance M., Amela R., MAGIC, Mulder H., Gloyn A. L., Groop L., Marchetti P., Eizirik D. L., Ferrer J., Mercader J. M., Cnop M., Torrents D., TIGER: The gene expression regulatory variation landscape of human pancreatic islets. Cell Rep. 37, 109807 (2021). - PMC - PubMed
    1. Walker J. T., Saunders D. C., Brissova M., Powers A. C., The human islet: Mini-organ with mega-impact. Endocr. Rev. 42, 605–657 (2021). - PMC - PubMed
    1. Cnop M., Abdulkarim B., Bottu G., Cunha D. A., Igoillo-Esteve M., Masini M., Turatsinze J.-V., Griebel T., Villate O., Santin I., Bugliani M., Ladriere L., Marselli L., McCarthy M. I., Marchetti P., Sammeth M., Eizirik D. L., RNA sequencing identifies dysregulation of the human pancreatic islet transcriptome by the saturated fatty acid palmitate. Diabetes 63, 1978–1993 (2014). - PubMed
    1. Rothberg A., Lean M., Laferrère B., Remission of type 2 diabetes: Always more questions, but enough answers for action. Diabetologia 67, 602–610 (2024). - PMC - PubMed