. 2025 Nov 22;121(14):2177-2188.
doi: 10.1093/cvr/cvaf187.

Activated CaMKIIδ translocates to the RyR nanodomain in cardiomyocytes

Affiliations

Activated CaMKIIδ translocates to the RyR nanodomain in cardiomyocytes

Anna Bergan-Dahl et al. Cardiovasc Res. .

Abstract

Aims: The heartbeat is triggered by the coordinated release of Ca2+ from the ryanodine receptor type-2 (RyR) in cardiomyocytes. Phosphorylation of RyR by Ca2+/calmodulin-dependent kinase IIδ (CaMKIIδ) fine-tunes this process in health, while hyperphosphorylation causes excessive, pathological Ca2+ release. We investigated how CaMKIIδ is spatially recruited and anchored to RyRs to achieve this functional regulation.

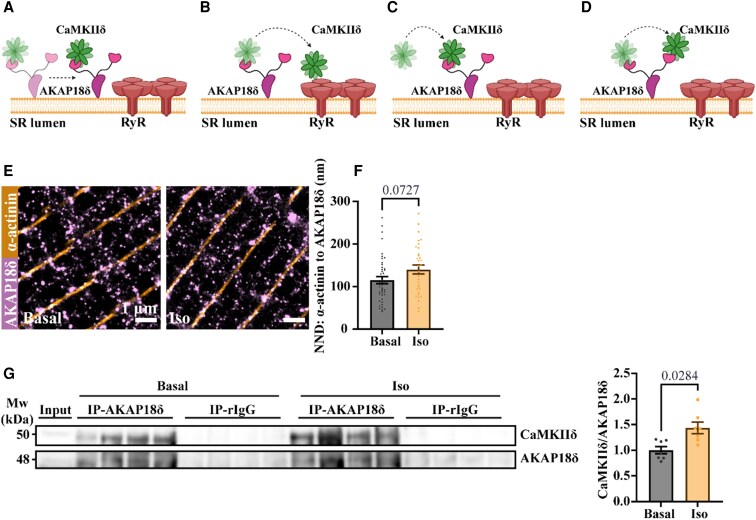
Methods and results: We employed confocal and dSTORM microscopy to investigate the macro- and nanoscale distribution of CaMKIIδ across cardiomyocytes, respectively. We linked positional rearrangement of the kinase during β-adrenergic stimulation (isoproterenol, Iso) to alterations in RyR phosphorylation and function (Ca2+ sparks), and the requirement of the CaMKIIδ anchoring protein AKAP18δ by knockdown/knockout. Confocal microscopy revealed that macroscale CaMKIIδ localization was not markedly altered during Iso-treatment, although a narrowing of its distribution around the Z-lines occurred, where the RyR reside. Higher resolution dSTORM imaging confirmed that local mobilization of CaMKIIδ by Iso decreased the distance from Z-lines and RyRs to the nearest CaMKIIδ by 28 and 12%, respectively. Functionally, kinase translocation into the RyR nanodomain was accompanied by increased channel phosphorylation and Ca2+ spark frequency. These actions were dependent on CaMKIIδ activity, since kinase translocation, RyR phosphorylation, and activation were all mimicked by the upstream activator of CaMKIIδ (8-CPT) and prevented by direct CaMKIIδ inhibitors (AIP, N1 peptide). A critical role of AKAP18δ in this mechanism was supported by immunoprecipitation experiments, which showed greater kinase binding to AKAP18δ during Iso-stimulation. Furthermore, loss of AKAP18δ by viral-mediated AKAP18δ knockdown or knockout prevented CaMKIIδ translocation to Z-lines. Microtubular disruption also blocked CaMKIIδ translocation.

Conclusion: Collectively, our results indicate that nanoscale movement of CaMKIIδ is closely associated with RyR activation following β-adrenergic stimulation. This translocation depends on an intact microtubular network and kinase binding to AKAP18δ.

Keywords: AKAP18δ; Ca(2+) homeostasis; CaMKIIδ; Cardiomyocyte; RyR.


Conflict of interest statement

Conflict of interest: none declared.

Figures

Graphical Abstract
Graphical Abstract
Graphical abstract created with BioRender.com.
Figure 1
Figure 1
β-Adrenergic stimulation promotes Ca2+/Calmodulin-dependent kinase IIδ (CaMKIIδ) translocation towards the ryanodine receptor (RyR) nanodomain. (A) Representative immunofluorescence images of RyR, CaMKIIδ, and an overlay with 4′,6-diamidino-2-phenylindole (DAPI) in isolated rat cardiomyocytes. (B, C) Representative images of α-actinin, CaMKIIδ, and an overlay at (B) baseline and (C) following isoproterenol (Iso, 100 nM, 10 min). (D) Representative fluorescence-intensity profile of CaMKIIδ from cardiomyocytes with basal or Iso-treatment. (E) Quantification of full-width-half-maximum (FWHM) from CaMKIIδ fluorescence peaks corresponding to α-actinin fluorescence peaks. Statistical differences examined by nested ANOVA (basal: nhearts = 10, ncells = 78; Iso: nhearts = 11, ncells = 63). (F) Representative two-colour 2D-dSTORM images of cardiomyocyte labelled with α-actinin and CaMKIIδ ± Iso. (G) Average nearest-neighbour distance (NND) from α-actinin to CaMKIIδ. (H) CaMKIIδ cluster proportions found within 50 nm increments from Z-line (α-actinin). Inset: Individual data points for clusters within 50 nm. (I) Representative two-colour dSTORM images of cardiomyocyte labelled with RyR and CaMKIIδ. (J) Average NND from RyR to CaMKIIδ. (K) CaMKIIδ cluster proportions found within 50 nm increments from RyR. Inset: Individual data points for clusters within 50 nm. Statistical differences examined by (G, J) Mann–Whitney test or (H, K) two-way ANOVA (see Supplementary material online, Tables S1 and S2) (G,H: basal: nhearts = 13, ncells = 78, Iso: nhearts = 10, ncells = 49, J, K: basal: nhearts = 10, ncells = 75, Iso: nhearts = 7, ncells = 52). (L) Representative confocal images of proximity ligation assay of RyR and CaMKIIδ with nuclei stained by DAPI. Right panel: number of fluorescent ligation events per μm2, normalized to respective basal treatment. Statistical differences examined by Mann–Whitney test (basal: nhearts = 3, ncells = 46, Iso: nhearts = 3, ncells = 47). Bar charts present mean values ± SEM with each data point representing the mean of one cardiomyocyte. XY-charts present mean values ± SD. Normality of distributions was confirmed by Shapiro–Wilk’s test. A P-value ≤ 0.05 was considered statistically significant.
Figure 2
Figure 2
CaMKIIδ translocation towards the RyR nanodomain is dependent on kinase activation and is accompanied by increased RyR phosphorylation and Ca2+ spark frequency. (A–D) Representative two-colour dSTORM images of (A) α-actinin and CaMKIIδ, or (C) RyR and CaMKIIδ in isolated rat cardiomyocytes following basal treatment, isoproterenol (Iso, 100 nM, 10 min), AIP (2 μM, 45 min) treatment following Iso-stimulation, or 8-CPT (10 μM, 10 min). NND from (B) α-actinin to CaMKIIδ or (D) RyR to CaMKIIδ was compared per cell. Statistical differences were examined by Kruskal–Wallis test with Dunn’s post hoc correction. (E) Proportion of CaMKIIδ clusters found within 50-nm increments from α-actinin clusters following basal, Iso, AIP + Iso, and 8-CPT treatment. Inset: individual data points for clusters within 50 nm of α-actinin. Statistical differences examined by a two-way ANOVA (see Supplementary material online, Table S8) (b, e: basal: nhearts = 13, ncells = 78, Iso: nhearts = 10, ncells = 49, AIP + Iso: nhearts = 6, ncells = 29, 8-CPT: nhearts = 5, ncells = 27, d: basal: nhearts = 10, ncells = 75, Iso: nhearts = 7, ncells = 52, AIP + Iso: nhearts = 3, ncells = 29, 8-CPT: nhearts = 5, ncells = 34). (F) Representative Western blots and quantification of the relative amount of CaMKIIδ-phosphorylated RyR (pSer2814-RyR) in cardiomyocytes following basal treatment, 8-CPT, Iso, or AIP + Iso. Values were normalized to basal treatment. Statistical differences examined by Kruskal–Wallis test with Dunn’s post hoc correction (basal: nhearts = 11, Iso: nhearts = 11, AIP + Iso: nhearts = 5, 8-CPT: nhearts = 5). (G) Representative Ca2+ spark recordings from Basal, Iso, 8-CPT, and AIP + Iso-treated cardiomyocytes, and measurements of (H) Ca2+ spark frequency and (I) spark size. Statistical differences examined by Kruskal–Wallis test with Dunn’s post hoc correction (h: basal: nhearts = 5, ncells = 57, Iso: nhearts = 6, ncells = 39, AIP + Iso: nhearts = 3, ncells = 19, 8-CPT: nhearts = 3, ncells = 18, i: basal: nhearts = 5, ncells = 21, Iso: nhearts = 6, ncells = 33, AIP + Iso: nhearts = 3, ncells = 5, 8-CPT: nhearts= 3, ncells = 13). Bar charts present mean values ± SEM with each data point representing the mean of (B, d, h, I) one cardiomyocyte or (F) heart. XY-Charts present mean values ± SD. Normality of distributions was confirmed by Shapiro–Wilk’s test. A P-value ≤ 0.05 was considered statistically significant.
Figure 3
Figure 3
The role of A-kinase anchoring protein 18δ (AKAP18δ) in CaMKIIδ anchoring and translocation. (A–D) Illustrations of potential roles of AKAP18δ in CaMKIIδ translocation following kinase activation, mediated via (A) movement of AKAP18δ, (B) release of CaMKIIδ from AKAP18δ, (C) recruitment of CaMKIIδ to AKAP18δ, (D) altered CaMKIIδ binding within AKAP18δ. Note that AKAP18δ is presented as a monomer for simplicity. The illustration displays a 1:2 stoichiometric relationship between CaMKIIδ and RyR for ease of presentation, although the true stoichiometry is not known. (E) Representative two-colour dSTORM images of α-actinin and AKAP18δ from basal and Iso-treated cardiomyocytes. (F) NND from α-actinin to AKAP18Iδ was compared per cell. Statistical differences examined by Mann–Whitney test (basal: nhearts = 6, ncells = 44, Iso: nhearts = 6, ncells = 32). (G) Immunoprecipitation of CaMKIIδ-AKAP18δ from basal or Iso-treated cardiomyocyte lysate. Rabbit IgG was used as a negative control. Statistical differences examined by Mann–Whitney test (basal: nhearts = 7, Iso: nhearts = 7). Bar charts present mean values ± SEM, with each data point representing the mean of (F) one cardiomyocyte or (G) heart. Normality of distribution confirmed by Shapiro–Wilk’s test. A P-value ≤ 0.05 was considered statistically significant. (A–D) Created with BioRender.com.
Figure 4
Figure 4
AKAP18δ is required for CaMKIIδ translocation. (A) mRNA expression of AKAP18 at 24-h intervals in isolated cardiomyocytes treated with adenovirus containing a scrambled control sequence or a short hairpin sequence targeting AKAP18. Statistical differences examined by Paired Student’s t-test (* P < 0.05, ** P < 0.01, n24h = 2, n48h = 2, n72h = 4, n96h = 7, and n120h = 2). (B, C) Effect of viral AKAP18-knockdown treatment (AKAP18-KD) on protein levels compared to a scrambled control virus (SCRM) in cardiomyocytes cultured for (B) 72 h or (C) 96 h post viral transduction. Significant differences examined by paired Student’s t-test (b: n = 3, c: n = 5). (D) Representative two-colour dSTORM images of α-actinin and CaMKIIδ from basal and isoproterenol (Iso, 10 min, 100 nM) treatment in rat cardiomyocytes cultured for 96 h with SCRM or AKAP18-KD virus. Effects of KD were examined on (E) NND from α-actinin to CaMKIIδ, and (F) the proportion of CaMKIIδ found within 50-nm increments of α-actinin. Inset: individual data points for clusters within 50 nm of α-actinin. (G–I) Representative recordings and measurements as in (D–F) in isolated cardiomyocytes from wild-type (WT) and AKAP18γ/δ-knockout (KO) mice. Statistical differences were examined by two-way ANOVA, with results displayed (E, H: Fisher’s Least Significant Difference (LSD) test) or in Supplementary material online, Tables S11 and S12 (F, I). (E, F: SCRM basal: nhearts = 6, ncells = 23, AKAP18-KD-basal: nhearts = 6, ncells = 15, SCRM-Iso: nhearts = 4, ncells = 13, AKAP18-KD-Iso: nhearts = 4, ncells = 12, h, i: WT-basal: nhearts 4 =, ncells = 23, KO-basal: nhearts = 5, ncells = 30, WT-Iso: nhearts = 4, ncells = 20, KO-Iso: nhearts = 5, ncells = 26). (J) Representative immunoblots and quantification of the relative amount of CaMKIIδ-phosphorylated RyR (pSer2814-RyR) in cardiomyocytes from SCRM or AKAP-KD rat cardiomyocytes treated with basal treatment or Iso. Licor was used to show equal protein loading. Values normalized to SCRM basal treatment. Statistical differences were examined by a two-way ANOVA with Fisher’s LSD test (n = 6). Bar charts present mean values ± SEM, with each data point representing the mean of (a, b, c, j) from one heart or (e, h) cardiomyocyte. XY-Charts present mean values ± SD. Normality of distributions confirmed by Shapiro–Wilk’s test. A P-value ≤ 0.05 was considered statistically significant.
Figure 5
Figure 5
Microtubular destabilization inhibits Iso-dependent CaMKIIδ translocation. (A) Representative two-colour dSTORM images of α-actinin (orange) and CaMKIIδ (cyan) in isolated cardiomyocytes treated with basal treatment or colchicine (Col, 10 μM, 2 h) ± Isoproterenol (Iso, 100 nM, and 10 min). (B) Effects on NND from α-actinin to CaMKIIδ. (C, D) Representative recordings and measurements as in (A, B) in cells treated with basal treatment with Dimethyl sulfoxide (DMSO) or nocodazole (Noc, 10 μM, 2 h) ± Iso (Noc + Iso). Significant differences examined by Kruskal–Wallis with Dunn’s post hoc comparisons. (E, F) Proportion of CaMKIIδ clusters found within 50-nm increments from α-actinin clusters. Inset: individual data points from clusters within 50 nm of α-actinin for (E) cells treated with basal treatment, Col or Col + Iso, or (F) cells treated with DMSO, Noc or Noc + Iso. Statistical differences examined by a two-way ANOVA (see Supplementary material online, Tables S13 and S14) (B, E: Basal: nhearts = 4, ncells = 26, Col: nhearts = 4, ncells = 26, Col + Iso: nhearts = 4, ncells = 25, D, F: DMSO: nhearts = 4, ncells = 20, Noc: nhearts = 4, ncells = 25, Noc + Iso: nhearts = 4, ncells = 20). Bar charts present mean values ± SEM with each data point representing the mean of one cardiomyocyte. XY-charts present mean values ± SD. Normality of distribution confirmed by Shapiro–Wilk’s test. A P-value ≤ 0.05 was considered statistically significant.

Comment in

  • Kinases go where the function calls.
    Said M, Mattiazzi A, Mundiña-Weilenmann C. Said M, et al. Cardiovasc Res. 2025 Nov 22;121(14):2116-2117. doi: 10.1093/cvr/cvaf197. Cardiovasc Res. 2025. PMID: 41118147 No abstract available.

References

    1. Bers DM. Cardiac excitation–contraction coupling. Nature 2002;415:198–205. - PubMed
    1. Eisner DA, Caldwell JL, Kistamás K, Trafford AW. Calcium and excitation-contraction coupling in the heart. Circ Res 2017;121:181–195. - PMC - PubMed
    1. Maier LS, Bers DM. Role of Ca2+/calmodulin-dependent protein kinase (CaMK) in excitation–contraction coupling in the heart. Cardiovasc Res 2007;73:631–640. - PubMed
    1. Rosenberg OS, Deindl S, Sung R-J, Nairn AC, Kuriyan J. Structure of the autoinhibited kinase domain of CaMKII and SAXS analysis of the holoenzyme. Cell 2005;123:849–860. - PubMed
    1. Hudmon A, Schulman H. Structure-function of the multifunctional Ca2+/calmodulin-dependent protein kinase II. Biochem J 2002;364:593–611. - PMC - PubMed

MeSH terms

Substances