. 2025 Oct 10;16(1):8967.
doi: 10.1038/s41467-025-64040-7.

Epidermal stem cells control periderm injury repair via matrix-driven specialization of intercellular junctions

Affiliations

Epidermal stem cells control periderm injury repair via matrix-driven specialization of intercellular junctions

Helen Mengze He et al. Nat Commun. .

Abstract

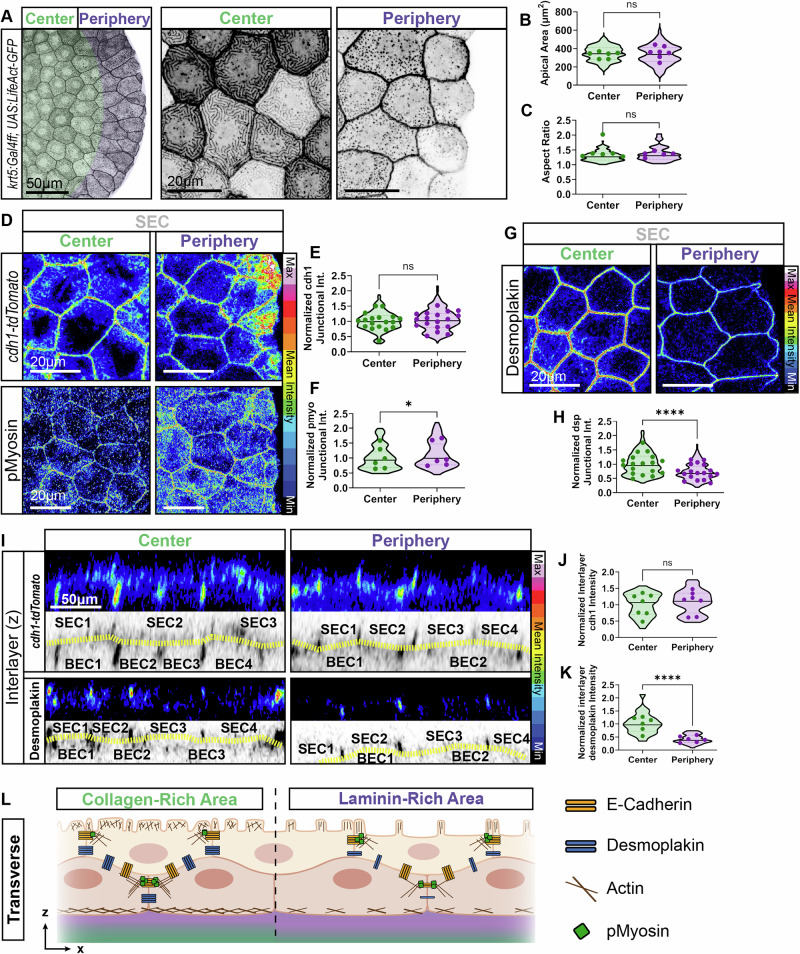
Epidermal stem cells interact with the extracellular matrix (ECM) to regulate their differentiation and maintain skin architecture. Here, we demonstrate a role for basal epidermal stem cells (BECs)-ECM interaction in regulating adhesion molecules expressed by the periderm-the superficial epidermal cells (SECs) of the embryonic bilayered skin. Using the developing zebrafish fin fold, we identify BECs form distinct regions of collagen- versus laminin- enriched basement membranes through integrin-mediated adhesions. Mechanistically, collagen-associated BECs form desmosomes and adherens junctions (AJs) with SECs while laminin-associated BECs display reduced desmosomes but sustain AJs and actomyosin expression with SECs. Notably, we show both in vivo and in a bilayered human keratinocyte model, that laminin, compared to collagen, is sufficient to repress desmosome formation while sustaining AJs specifically at the interlayer cell contacts. In vivo, laminin deficiency enhances desmosome expression across layers and impairs the wound-healing capacity of SECs. This defect was partially rescued by genetic reduction of the desmosome protein Desmoplakin-1a, highlighting the role of ECM-dependent junctional specialization in mediating differences in SEC injury response. Overall, our findings identify that stem cells, through their matrix, establish specialized junctions in the overlying stratified epithelium, which contribute to skin healing properties.


Conflict of interest statement

Competing interests: The authors declare no competing interests.

Figures

Fig. 1
Fig. 1. Region-Specific Junctional and Cytoskeletal Organization of BECs in the Fin Fold.
A Zebrafish fin fold 2-2.5 days post fertilization (dpf). Basal epidermal stem cells (BECs) on basement membrane extracellular matrix (ECM) and superficial epidermal cells (SECs) (transverse). B Representative images of TgBAC(ΔNP63:Gal4ff)la213; Tg(UAS:NLS-GFP)el609 BECs at 48hpf, 16-color intensity scale. C Nuclear GFP mean intensity quantification across fin fold. Y-axis: Average normalized intensity/embryo, x-axis: normalized distance from fin fold center (1.0 = fin fold edge). Simple linear regression (red dashed line) (slope=0.2743, n = 42 embryos, two independent experiments). D Representative image of FAM-tagged collagen-hybridizing peptide (left) and Laminin-A1 protein (right). Intensity is displayed using a fire LUT. E Quantification of normalized intensity from fin fold edge (edge = 0 µm). Periphery<50 µm from edge, Center>50 µm. F Violin plot of averaged values for center and periphery/embryo (Kruskal-Wallis test with multiple comparisons, p < 0.0001, n = 41 embryos; 4 independent experiments). G Representative image of TgBAC(ΔNP63:Gal4ff)la213; Tg(UAS:LifeAct-GFP)mu271 in central and peripheral regions as defined in panels E and F. Quantification of (H) BEC area and (I) aspect ratio displayed as a violin plot (distribution=individual cells) with average values/embryo (dots) in central and peripheral regions (two-tailed Mann-Whitney test on violin plots, p < 0.0001 (BEC area and aspect ratio), n = 114-152 cells, dots n = 8–14 embryos; 2 independent experiments). J, N Representative images showing (J) TgBAC(ΔNP63:Gal4ff)la213; Tg(UAS:LifeAct-GFP)mu271 for endogenous E-cadherin labeling, alongside immunofluorescence staining for phosphorylated-myosin light chain and (N) desmoplakin1/2 in central and peripheral regions of fin fold BECs at 48hpf. Z-stack images obtained from SEC-BEC layer. BECs identified by max projection of selected z-slices based on z-position, 16-color intensity scale. K–M, O Quantification of (K) BEC-LifeAct-GFP/cell, junctional (L) E-cadherin, (M) phospho-myosin light chain, and (O) desmoplakin1/2, shown as violin plots (distribution=individual junctions, average values/embryo=dots). Intensity normalized to Center group for each graph. (two-tailed Mann-Whitney test, p < 0.0001 (LifeAct, Desmoplakin), p = 0.000003 (pMyosin), n = 172-175 cells and (BEC-LifeAct), 240 junctions (E-cadherin), 93-120 junctions (pMyosin), and 284-348 junctions (Desmoplakin), dots n = 13-14 (BEC-LifeAct; 2 independent experiments), 18 (E-cadherin; 4 independent experiments), 6 (pMyosin; 1 independent experiment), and 18 (desmoplakin; 2 independent experiments) (P) Summary schematic of intercellular junctions in BECs above laminin- vs. collagen-positive basement membranes. Source data are provided as a Source Data file.
Fig. 2
Fig. 2. Differential Cytoskeletal and Junctional Organization in SECs Across Central and Peripheral ECM Zones.
A Representative image of Tg(krt5:Gal4ff)la212; Tg(UAS:LifeAct-GFP)mu271 fin fold central region (green) and peripheral boundary (purple) as defined in Fig. 1D–F. Quantifications of (B) SEC apical area and (C) aspect ratio by violin plot (distribution=individual cells, dots=average values/embryo). (apical area: two-tailed unpaired t test p = 0.4548, n = 83-86 cells, dots n = 6-7; aspect ratio: two-tailed Mann-Whitney test p = 0.1672, n = 48-160 cells, dots n = 5-6; both: 3 independent experiments). D, G Representative images showing (D) cdh1-tdTomatoxt18, alongside immunofluorescence staining for phosphorylated-myosin light chain and (G) desmoplakin1/2 at 48hpf. Z-stack images from SEC-BEC layer. SECs identified by max projection of selected z-slices by z-position. 16-color intensity scale. E, F, H Quantification of intensity for junctional (E) E-cadherin, (F) phospho-myosin light chain, and (H) desmoplakin1/2 across embryos, shown as violin plots (distribution=individual junctional measurements, dots=average values/embryo). Intensity normalized to Center group for each graph (two-tailed Mann-Whitney test on violin plots, p = 0.2577 (E-cadherin), 0.0457 (pMyosin), and p < 0.0001 (Desmoplakin), n = 372 junctions (E-cadherin), 99-119 junctions (pMyosin), and 362-366 junctions (Desmoplakin), dots n = 18 (E-cadherin; 4 independent experiments), 6 (pMyosin; 1 independent experiment), and 18 (desmoplakin; 2 independent experiments) embryos). Source data are provided as a Source Data file. I Representative orthogonal view of the fin fold, showing live imaging of cdh1-tdTomatoxt18 or desmoplakin1/2 immunofluorescence staining in collagen-enriched (center) and laminin-enriched (periphery) regions. (Top) Images displayed using 16-color scale. (Bottom) Interface membrane (yellow dashed lines) between SEC and BEC layers, with numbers corresponding to each analyzed cell. J, K Quantification of interlayer (yellow dashed lines) (J) E-cadherin and (K) desmoplakin across embryos, individual measurements distribution shown as violin plots and average values per embryo as dots. Intensity was normalized to the Center group for each graph (two-tailed Mann-Whitney test on violin plots, p = 0.2917 (E-cadherin) and p < 0.0001 (Desmoplakin), n = 70 (E-cadherin), and 60 cells (desmoplakin), dots n = 7 (E-cadherin; 2 independent experiments) and 6 (desmoplakin; 1 independent experiment) embryos). L Summary schematic of junctional characteristics in SECs, SEC-BEC interface, and BECs. Source data are provided as a Source Data file.
Fig. 3
Fig. 3. BEC-ECM Adhesions Regulate the Balance Between Desmosome and Cadherin Junctions Across Layers.
A Representative image of wild type (WT) vs. itgb1a+/-, itgb1b+/- fin fold, stained with a FAM-tagged collagen hybridizing peptide and Laminin-A1 at ~48hpf. Intensity displayed using fire LUT. B Quantification of normalized collagen and laminin intensity across fin fold (edge = 0 µm). Each curve is normalized to individual embryo maximum. C Quantification of average normalized collagen and laminin intensity/embryo (Collagen: Ordinary One-Way ANOVA test with multiple comparisons, p = 0.6422 (Center) and 0.4573 (Periphery), n = 18 (WT) and 27 (itgb1a+/-, itgb1b+/-) embryos; 3 independent experiments; Laminin: Kruskal-Wallis test with multiple comparisons, p > 0.9999, n = 6 (WT) and 11 (itgb1a+/-, itgb1b+/-) embryos; 2 independent experiments. D, F,H, J Representative images of cdh1-tdTomatoxt18 ((D) center and (F) periphery and immunofluorescence staining for desmoplakin (H) center and (J) periphery in zebrafish fin folds at 48hpf. Images show SECs, Interlayer (SEC-BEC), and BECs. Z-stack images were taken from the SEC-BEC layer. SECs and BECs were identified by maximum projection of selected z slices based on their z-position. Representative interlayer images are shown in orthogonal view of single z slice. 16-color intensity scale. E, G, I, K Quantification of E-cadherin (E) center and (G) periphery and desmoplakin (I) center and (K) periphery at SEC junctions, interlayer, and BEC junctions shown as violin plot (distribution=individual junctional measurements, dots= average values/embryo). E, G For all graphs, E-cadherin intensity was normalized to the WT Center BEC group (Violin plots tested for two-tailed unpaired t test (Center Interlayer) and two-tailed Mann-Whitney test for all other comparisons, p < 0.0001 (all comparisons), n = 180−200 junctions (SEC and BEC junctions) and 90–100 cells (interlayer), dots n = 9 (WT) and 10 (itgb1a+/-, itgb1b+/-) embryos; 2 independent experiments). I, K For all graphs, desmoplakin intensity was normalized to the WT Center BEC group (Violin plots tested for two-tailed Mann-Whitney test, p < 0.0001 (all comparisons), n = 359 − 395 junctions (SEC and BEC junctions) and 188−190 cells (interlayer), dots n = 20 (WT) and 19 (itgb1a+/-, itgb1b+/-) embryos; 2 independent experiments). Source data are provided as a Source Data file.
Fig. 4
Fig. 4. Human epidermal keratinocytes on different ECMs differentially regulate the expression of adherens junctions and desmosomes across layers in vitro.
A Representative immunofluorescence images of P63, F-actin, and DAPI in both layers of the bilayer normal human epidermal keratinocytes (NHEK). DAPI image is z-depth color-coded. B Quantification of P63 intensity (two-tailed unpaired t-test, p < 0.0001, n = 15 (Basal) and 16 (Suprabasal) containing 5–20 cells/FOV (fields of view); 1 independent experiment). Box plot whiskers represent the minimum and maximum value. Bounds mark the 25th and 75th percentiles. Central line is the median. C Schematic of gel constructs containing 100% collagen (Collagen) and 100% collagen gel coated with laminin (Col (LM-coated)). D Representative immunofluorescence z-stack cross sections of NHEKs cultured on each gel system. E Representative immunofluorescence images of β-Catenin (CTNNB1) in culture on each gel type. Images of the Suprabasal, Interlayer (Suprabasal-Basal), and Basal shown. Intensity displayed using a 16-color scale. F Quantification of CTNNB1 intensity at junctions for Suprabasal, Interlayer, and Basal in NHEKs cultured on each gel system. For each graph, intensity was normalized to the Collagen Gel Group (two-tailed unpaired t-test (Suprabasal and Basal) and two-tailed Mann-Whitney test (Interlayer), p = 0.0046 (Suprabasal), 0.2213 (Interlayer), and p < 0.0001 (Basal), n= Suprabasal: 44 (Collagen) and 51 (Col LM coated) cells, Interlayer: 53 cells (Collagen and Col LM coated), and Basal: 41 (Collagen) and 44 (Col LM-coated) cells; 1 independent experiment). Data presented as box plots with whiskers to minimum and maximum value. Bounds mark the 25th and 75th percentiles. Central line is the median. G Representative immunofluorescence images of Desmoplakin (DSP) in culture on each gel type. Layers and intensity displayed as in (E). H Quantification of Desmoplakin intensity at junctions as in (F). (two-tailed unpaired t-test (Suprabasal and Interlayer) and two-tailed Mann-Whitney test (Basal), p = 0.0042 (Suprabasal) and p < 0.0001 (Interlayer and Basal), n= Suprabasal: 41 (Collagen) and 42 (Col LM coated) cells, Interlayer: 48 (Collagen) and 50 (Col LM coated) cells, and Basal: 40 (Collagen) and 42 (Col LM-coated) cells; 1 independent experiment). Data presented as box plots with whiskers to minimum and maximum value. Bounds mark the 25th and 75th percentiles. Central line is the median. Source data are provided as a Source Data file.
Fig. 5
Fig. 5. BEC-laminin interactions regulate desmosomes, AJs, and actomyosin signaling in the peripheral bilayer epidermis of the fin fold.
A Representative immunofluorescence image of wild type (WT) vs. lama5+/- vs. col1a1a+/- fin fold, stained with FAM-tagged collagen-hybridizing peptide and Laminin-A1 at ~48hpf. Intensity displayed using fire LUT. B Quantification of average normalized collagen and laminin intensity/embryo. (Collagen: Kruskal-Wallis test with multiple comparisons, p > 0.9999, n = 20 (WT) and 26 (lama5+/-) embryos; 2 independent experiments; Laminin: Ordinary One-Way ANOVA test with multiple comparisons, p = 0.2249 (Center) and 0.0006 (Periphery), n = 18 (WT) and 28 (lama5+/-) embryos; 2 independent experiments. C Quantification as in B. (Collagen: Kruskal-Wallis test with multiple comparisons, p = 0.0246 (Center) and > 0.9999 (Periphery), n = 27 (WT) and 33 (col1a1a +/-) embryos; 3 independent experiments; Laminin. Ordinary One-Way ANOVA test with multiple comparisons, p = 0.8872 (Center) and 0.2019 (Periphery), n = 13 (WT) and 18 (col1a1a +/-) embryos; 2 independent experiments. D, F Representative (D) images of cdh1-tdTomatoxt18 and (F) immunofluorescence staining for desmoplakin in peripheral fin fold region at ~48hpf. Z-stack images taken from SEC-BEC layer. SECs and BECs identified by maximum projection of selected z-slices based on z-position. Representative interlayer images shown in orthogonal view of single z-slice. Intensity displayed using 16-color scale. E, G Quantification of (E) E-cadherin and (G) desmoplakin at junctions in peripheral SEC, interlayer (SEC-BEC), and BEC layers shown as violin plot (distribution=individual junctional measurements; dots= average values/embryo). E For all graphs, E-cadherin intensity was normalized to the WT Center BEC group in panel Extended Data Fig. 5C (two-tailed Mann-Whitney test on violin plots, p = 0.2132 (SEC), 0.4736 (Interlayer), and p < 0.0001 (BEC), n = 348-363 junctions (SEC and BEC junctions) and 160-169F cells (interlayer), dots n = 19 (WT) and 18 (lama5+/-) embryos; 3 independent experiments). G For all graphs, desmoplakin intensity was normalized to the WT Center BEC group in panel Extended Data Fig. 5E (two-tailed Mann-Whitney test on violin plots, p = 0.0014 (SEC), 0.0036 (BEC), and p < 0.0001 (Interlayer), n = 232-240 junctions (SEC and BEC junctions) and 117-120 cells (interlayer), dots n = 12 (WT) and 12 (lama5+/-) embryos; 2 independent experiments) (H, J) Representative (H) images of cdh1-tdTomatoxt18 and (J) immunofluorescence staining for desmoplakin in central fin fold region at ~48hpf as in (D, F). I, K Quantification of (I) E-cadherin and (K) Desmoplakin at central SEC junctions as in (E, G). I For all graphs, E-cadherin intensity was normalized to the WT Center BEC group in bottom panel Fig. 5I (two-tailed unpaired t-test for BEC Center and two-tailed Mann-Whitney test on all other violin plots, p = 0.0001 (SEC), 0.0009 (Interlayer), and 0.04825 (BEC), n = 170 junctions (SEC and BEC junctions) and 110 cells (interlayer), dots n = 11 (WT) and 11 (col1a1a+/-) embryos; 1 independent experiment). K For all graphs, Desmoplakin intensity was normalized to the WT Center BEC group in panel Fig. 5K (two-tailed unpaired t-test on Interlayer, and two-tailed Mann-Whitney test on all other violin plots, p < 0.0001 (SEC), p = 0.01437 (BEC) and 0.0011 (Interlayer); n = 62-82 junctions (SEC and BEC junctions) and 50–60 cells (interlayer), dots n = 6 (WT) and 6 (col1a1a+/-) embryos; 1 independent experiment) (L) Summary schematic of junctional characteristics in the peripheral regions of SECs, SEC-BEC interface, and BECs. Source data are provided as a Source Data file.
Fig. 6
Fig. 6. BEC-Laminin Interactions are Required for Efficient Wound Closure in the Periderm.
A Representative live confocal images of Tg(krt5:Gal4ff)la212; Tg(UAS:LifeAct-GFP)mu271 for LifeAct-GFP under SEC-specific krt5 promoter, showing the central and peripheral regions of the fin fold at 2dpf before and after single-cell ablation. Shaded border indicates the ablated cell and subsequent wound closure. B Quantification of time (min) required for complete wound closure. Data presented as box plots with whiskers to minimum and maximum value. Bounds mark the 25th and 75th percentiles. Central line is the median. (two-tailed Mann-Whitney test, p = 0.0040, n = 8 (Center) and 6 (Periphery) embryos; 4 independent experiments). C Representative live confocal images of Tg(krt5:Gal4ff)la212; Tg(UAS:LifeAct-GFP)mu271 for LifeAct-GFP under the SEC-specific krt5 promoter in the peripheral regions of fin fold of indicated genotypes at 2dpf before and after single-cell ablation. Shaded border indicates the ablated cell and subsequent wound closure. D Quantification of periphery wound closure time (min), comparing WT and dspa+/- mutants. Data presented as box plots with whiskers to minimum and maximum value. Bounds mark the 25th and 75th percentiles. Central line is the median. (Mann-Whitney test, p = 0.7879, n = 6 (WT) and 5 (dspa+/-) embryos; 4 independent experiments). E Quantification of wound closure time (min), comparing periphery WT, lama5+/-, and lama5+/-, dspa+/- mutants. Data presented as box plots with whiskers to minimum and maximum value. Bounds mark the 25th and 75th percentiles. Central line is the median. (Kruskal-Wallis test with multiple comparisons; p = 0.0273 (WT vs. lama5+/-), > 0.9999 (WT vs. lama5+/-, dspa+/-), and 0.1988 (lama5+/- vs. lama5+/-, dspa+/-); n = 6 (WT), 9 (lama5 +/-), and 5 (lama5+/-, dspa+/-) embryos; 5 independent experiments. Source data are provided as a Source Data file.
Fig. 7
Fig. 7. Schematic Illustration of how BEC-ECM Interactions Influence Periderm Architecture and Wound Repair.
We propose that the interaction between basal epidermal stem cells (BECs) and laminin influences the junctional organization and injury response of the periderm, via the regulation of interlayer junction dynamics. The developing bilayered skin appendage is organized as collagen-enriched areas, where BECs exhibit increased adherens junction (AJ) actomyosin signaling and desmosome formation. Superficial epidermal cells (SECs) layer (the periderm) above these BECs display reduced motility, characterized by stronger desmosomal junctions and less actomyosin signaling. In laminin-rich areas, BECs show decreased actomyosin activity and reduced AJ and desmosome formation within the intralayer, but they unexpectedly maintain interlayer AJ and repress desmosome formation. SECs above these BECs have faster motility during wound closure. Partial removal of laminin matrices further reduces BEC actomyosin activity, AJ and desmosome formation while increasing desmosome connections at the interfaced membrane with SECs. SECs, connected to these BECs, exhibit increased desmosome overall, and slow wound closure.

Update of

References

    1. Morgner, J. et al. Integrin-linked kinase regulates the niche of quiescent epidermal stem cells. Nat. Commun.6, 8198 (2015). - PMC - PubMed
    1. Lu, P., Weaver, V. M. & Werb, Z. The extracellular matrix: a dynamic niche in cancer progression. J. Cell Biol.196, 395–406 (2012). - PMC - PubMed
    1. Gjorevski, N. et al. Designer matrices for intestinal stem cell and organoid culture. Nature539, 560–564 (2016). - PubMed
    1. Fuchs, E. & Blau, H. M. Tissue stem cells: architects of their niches. Cell Stem Cell27, 532–556 (2020). - PMC - PubMed
    1. Watt, F. M. & Hogan, B. L. Out of Eden: stem cells and their niches. Science287, 1427–1430 (2000). - PubMed

MeSH terms

LinkOut - more resources