. 2025 Oct 10;16(1):9034.
doi: 10.1038/s41467-025-64096-5.

Histone lactylation promotes rheumatoid arthritis progression by increasing NFATc2 expression and the production of anti-lactylated histone autoantibodies

Affiliations

Histone lactylation promotes rheumatoid arthritis progression by increasing NFATc2 expression and the production of anti-lactylated histone autoantibodies

Gan Wu et al. Nat Commun. .

Abstract

Elevated lactate in the joint microenvironment of rheumatoid arthritis patients is crucial for disease progression, though the mechanism remains unclear. This study shows significantly increased global lactylation levels within fibroblast-like synoviocytes from RA patients compared to healthy controls, with lactylated proteins being enriched in histones. Furthermore, we find anti-lactylated histone autoantibodies present in RA patients that positively correlate with Disease Activity Score 28. Using CUT&Tag and RNA-seq, we identify NFATc2 as a key target gene regulated by histone H3 lysine 9 lactylation. Functional studies reveal that NFATc2 promotes migration of RA-FLSs. Additionally, using collagen antibody-induced arthritis and collagen-induced arthritis mouse models, we demonstrate that NFATc2 exacerbates RA disease progression through enhancing the cartilage invasive function of FLS. Here, we show that upregulated target gene NFATc2 by lactate-dependent histone lactylation, can be used as a potential therapeutic target for intervention, anti-lactylated histone autoantibodies is promising as a diagnostic marker for RA.


Conflict of interest statement

Competing interests: The authors declare no competing interests.

Figures
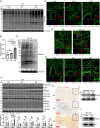
Fig. 1
Fig. 1. The global lactylation and histone lactylation increased in FLSs and synovial tissues from RA patients.
A, B The global lactylation levels of FLSs from HC (n = 4), GA patients (n = 5) and RA patients (n = 5). C Immunofluorescence images of Pan Kla (red, bind lactylated proteins), β-Tubulin (green, bind β-Tubulin) and DAPI (blue, bind nucleus) in HC-FLS, GA-FLS and RA-FLS, scale bar = 100 μm. D The levels of global lactylation in RA-FLS treated with lactate (10 mM), sodium lactate (10 mM) or hydrochloric acid for 24 h. E Immunofluorescence images of Pan Kla (red, bind lactylated proteins), β-Tubulin (green, bind β-Tubulin) and DAPI (blue, bind nucleus) of RA-FLS treated with lactate (10 mM) for 24 h, scale bar = 100 μm. F The histone lactylation of FLSs from HC (n = 4), GA patients (n = 5) and RA patients (n = 5). G Immunofluorescence images of H3K9la (red, bind H3K9la), β-Tubulin (green, bind β-Tubulin) and DAPI (blue, bind nucleus) in HC-FLS, GA-FLS and RA-FLS, scale bar = 100 μm. H IHC staining images of H3K9la in synovial tissue from HC, GA patients and RA patients, scale bar = 100 μm. I The H3K9la levels were detected in synovial tissues from HC, GA patients and RA patients by Western blot. J The level of H3K9la in RA-FLS treated with lactate (10 mM) was detected by Western blot. All of the experiments were performed three independent experiments. Data were presented with means ± SD. F Two-way ANOVA with Turkey’s post hoc test, test was two-sided. Source data are provided with this paper.
Fig. 2
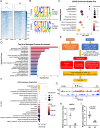
Fig. 2. Screening the target genes regulated by H3K9la in RA-FLSs using CUT&Tag and RNA-seq.
A The heatmap of H3K9la binding density in FLSs from RA patients and HC was visualized by deepTools. Color depth indicates the relative number of reads. B The top enriched motifs bind to H3K9la. C KEGG analysis of differential genes binding by H3K9la. D The top 20 GO terms of differentially expressed genes from RNA-seq. E Bioinformatics analysis filtered NFATc2 as a downstream target of H3K9la. F The top 20 GO terms of 68 target genes that were both overexpressed in RA-FLS and highly enriched in H3K9la binding DNA sequences. G IGV tracks for NFATc2 from CUT&Tag analysis, The red triangles indicate the peak regions of H3K9la on NFATc2 promoter. H ChIP-qPCR assay of H3K9la occupancy rates in the NFATc2 promoter region in FLSs (n = 4 per group). I RT-qPCR assay of NFATc2 expression in FLSs (n = 10 per group). Data were presented with means ± SD. B, C, F Hypergeometric test. H, I Two-sided unpaired t test. Source data are provided with this paper.
Fig. 3
Fig. 3. Overexpression of NFATc2 promotes RA disease progression by enhancing FLSs migration and invasion.
A The expression of NFATc2 in FLSs from RA patients (n = 4) and HC (n = 4) were detected by WB. B IHC staining images of NFATc2 in synovial tissue from RA patients and HC, scale bar = 50 μm. C Immunofluorescence images of NFATc2 (red) of RA-FLS and HC-FLS, scale bar = 100 μm. D The expression of NFATc2 in RA-FLS infected with shNC or shNFATc2s was detected by WB. E The timeline of CAIA mice experiment (n = 5 per group). F Clinical scores of mice. The scoring system was defined as 0 = no evidence of erythema and swelling, 1 = erythema, and mild swelling confined to the tarsals or ankle joint, 2 = erythema and mild swelling extending from the ankle to the tarsals, 3 = erythema and moderate swelling extending from the ankle to the metatarsal joints, and 4 = erythema and severe swelling encompass the ankle, foot, and digits, or ankylosis of the limb. Significance was tested using analysis of variance (ANOVA) of repeated measurement. G Histopathological images of mice. The knee joints of mice were stained by H&E and Safranin O Fast Green staining. H Histopathological analysis of H&E staining. Semiquantitative scores for inflammatory cell infiltration, synovial hyperplasia, and bone destruction were assessed and graded on a scale of 0 (normal) to 3 (severe) for 4 paws for the histological score. IL The levels of TNF-α, IL-6, IL-1β and IL-10 in serum were detected by ELISA. AD The experiments were performed three independent experiments. Data were presented with means ± SD. F Variance (ANOVA) of repeated measurement. HL Two-way ANOVA with Šídák’s post hoc test. Source data are provided with this paper.
Fig. 4
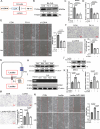
Fig. 4. Inhibition of endogenous and exogenous lactate reduces H3K9la levels and cell migration of RA-FLS.
A Schematic diagram of endogenous lactate inhibition target. B The H3K9la levels of RA-FLS treated with FX-11(10 μM) or transfected with siLDHA were detected by WB. C ChIP-qPCR assay of H3K9la occupancy rates in the NFATc2 promoter region in RA-FLS treated with FX-11(10 μM) or transfected with siLDHA. D RT-qPCR assay of NFATc2 expression in RA-FLS treated with FX-11(10 μM) or transfected with siLDHA. E Scratch migration assay of RA-FLS treated with FX-11(10 μM) or transfected with siLDHA. F Transwell assay of RA-FLS treated with FX-11(10 μM) or transfected with siLDHA. G Schematic diagram of exogenous lactate inhibition target. H The expression of MCT1 in RA-FLS were detected by WB. I The expression of GPR81 in RA-FLS were detected by nucleic acid electrophoresis (upper panel) and WB (lower panel). J The H3K9la levels of RA-FLS treated with sodium lactate (10 mM) or sodium lactate (10 mM) + AZD-3965 (100 nM). K ChIP-qPCR assay of H3K9la occupancy rates in the NFATc2 promoter region in RA-FLS treated with sodium lactate (10 mM) or sodium lactate (10 mM) + AZD-3965 (100 nM). L RT-qPCR assay of NFATc2 expression in RA-FLS treated with sodium lactate (10 mM) or sodium lactate (10 mM) + AZD-3965 (100 nM). M Transwell assay of RA-FLS treated with sodium lactate (10 mM) or sodium lactate (10 mM) + AZD-3965 (100 nM). N Scratch migration assay of RA-FLS treated with sodium lactate (10 mM) or sodium lactate (10 mM) + AZD-3965 (100 nM). B, HJ The experiments were performed three independent experiments. CF, KN Data represent three independent experiments. Data were presented with means ± SD. CF, KN one-way ANOVA with Turkey’s post hoc test. Source data are provided with this paper.
Fig. 5
Fig. 5. Reducing H3K9la and NFATc2 levels alleviates joint destruction in CIA mice.
A The timeline of the FX-11 or AZD-3965 treated CIA mice experiment (n = 10 per group). B Clinical scores of mice. The scoring system was defined as 0 = no evidence of erythema and swelling, 1 = erythema, and mild swelling confined to the tarsals or ankle joint, 2 = erythema and mild swelling extending from the ankle to the tarsals, 3 = erythema and moderate swelling extending from the ankle to the metatarsal joints, and 4 = erythema and severe swelling encompass the ankle, foot, and digits, or ankylosis of the limb. Significance was tested using analysis of variance (ANOVA) of repeated measurement. C Macroscopic images, histopathological images and immunofluorescence images of CIA mice. Macroscopic images of mice were observed on day 49 before being sacrificed. The knee joints of mice were stained by H&E (eosin stains the cytoplasm red, and hematoxylin stains the nuclei blue) and Safranin O Fast Green (cartilage is red when combined with safranin O, and bone is blue when combined with solid green) staining. Immunofluorescence images of H3K9la (red, bind H3K9la), NFATc2 (green, bind NFATc2) and DAPI (blue, bind nucleus) in knee joints. D Histopathological analysis of H&E staining. Semiquantitative scores for inflammatory cell infiltration, synovial hyperplasia, and bone destruction were assessed and graded on a scale of 0 (normal) to 3 (severe) for 4 paws for the histological score (n = 10 per group). EH The levels of TNF-α, IL-6, IL-1β and IL-10 in serum were detected by ELISA (n = 10 per group). Data were presented with means ± SD. B Variance (ANOVA) of repeated measurement, test was two-sided. D, EH One-way ANOVA with Turkey’s post hoc test. Source data are provided with this paper.
Fig. 6
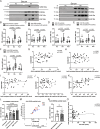
Fig. 6. Detected the levels of anti-lactylated histone autoAbs in serum of HC, PsA patients and RA patients.
A The levels of lactylated histone antigen in serum were detected by WB. BE Anti-lactylated histone and anti-histone autoAbs were measured in serum of HC (n = 50), PsA patients (n = 20) and RA patients (n = 50) by ELISA, including total histone (H2B, H3 and H4 together), H2B, H3 or H4. F Anti-H3K9la and anti-H3K9 autoAbs were measured in serum of HC (n = 50), PsA patients (n = 20) and RA patients (n = 50) by ELISA. GJ Correlation between the level of anti-histone autoAbs in serum and Disease Activity Score 28-joint count were evaluated by Pearson correlation coefficient. K Correlation between the level of anti-H3K9la autoAbs in serum and Disease Activity Score 28-joint count (r = 0.5431, p < 0.0001) were evaluated by Pearson correlation coefficient. L The level of anti-H3K9la autoAbs in serum of RA patients in remission (n = 10), RA patients with low activity (n = 5), RA patients with moderate activity (n = 28) and RA patients with high activity (n = 7). M The level of anti-H3K9la autoAb in individual RA patients with different disease course (n = 3). N The level of anti-H3K9la autoAbs in serum of seronegative RA patients (n = 11) and seropositive RA patients (n = 39). O Correlation between Anti-CCP and the level of anti-H3K9la autoAbs in serum were evaluated by Pearson correlation coefficient. A The experiments were performed three independent experiments. Data were presented with means ± SD. BF two-way ANOVA with Turkey’s post hoc test, test was two-sided. GK, O tests were two-sided. L One-way ANOVA with Turkey’s post hoc test. N Two-sided unpaired t test. Source data are provided with this paper.

References

    1. Smolen, J. S. et al. Rheumatoid arthritis. Nat. Rev. Dis. Prim.4, 18001 (2018). - PubMed
    1. Lefèvre, S. et al. Synovial fibroblasts spread rheumatoid arthritis to unaffected joints. Nat. Med.15, 1414–1420 (2009). - PMC - PubMed
    1. Komatsu, N. & Takayanagi, H. Mechanisms of joint destruction in rheumatoid arthritis - immune cell-fibroblast-bone interactions. Nat. Rev. Rheumatol.18, 415–429 (2022). - PubMed
    1. McInnes, I. B. & Schett, G. Pathogenetic insights from the treatment of rheumatoid arthritis. Lancet389, 2328–2337 (2017). - PubMed
    1. Orr, C. et al. Synovial tissue research: a state-of-the-art review. Nat. Rev. Rheumatol.13, 463–475 (2017). - PubMed

MeSH terms

LinkOut - more resources