. 2025 Oct 10;15(1):35413.
doi: 10.1038/s41598-025-08564-4.

Integrative functional genomics analysis of Kaposi sarcoma cohorts

Affiliations

Integrative functional genomics analysis of Kaposi sarcoma cohorts

Ezequiel Lacunza et al. Sci Rep. .

Abstract

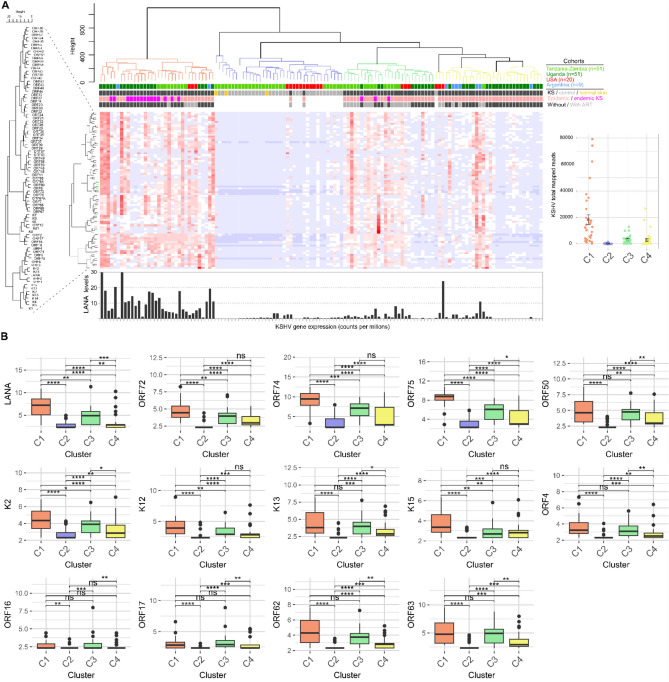
Kaposi sarcoma (KS) is an AIDS-defining cancer and a significant global health challenge caused by KS-associated herpesvirus (KSHV). NGS-based approaches have profiled KS lesions in a minimal number of studies compared with other neoplastic diseases. Here we present a compiled and harmonized dataset of 131 KS and non-tumor cutaneous samples in the context of their predicted pathway activities, immune infiltrate, KSHV and HIV gene expression profiles, and their associated clinical data representing patient populations from Argentina, United States (USA), and Sub-Saharan Africa cohorts. RNA-seq data from 9 Argentinian KS lesions were generated and integrated with previously published datasets derived from the USA and sub-Saharan African cohorts from Tanzania, Zambia, and Uganda. An unsupervised analysis of 131 KS-related samples allowed us to identify four KS clusters based on their host and KSHV gene expression profiles, immune infiltrate, and the activity of specific signaling pathways. The compiled RNA-seq profile is shared with the research community through the UCSC Xena browser for further visualization, download, and analysis ( https://kaposi.xenahubs.net/ ). These resources will allow biologists without bioinformatics knowledge to explore and correlate the host and viral transcriptome in a curated dataset of different KS RNA-seq-based cohorts, which can lead to novel biological insights and biomarker discovery.

Keywords: Kaposi’s sarcoma; RNAseq; Transcriptome; Xena browser.


Conflict of interest statement

Declarations. Ethics declarations: MJG is a consultant for the Fred Hutchinson Cancer Research Center. The other authors declare no competing interests. Competing interests: The authors declare no competing interests.

Figures

Fig. 1
Fig. 1
Compiled KS dataset of 131 KS and matched non-tumor tissues. (A) Diagram of the Strategy followed to obtain the compiled KS dataset. (B) Multidimensional scaling plot of the non-adjusted (left) and batch-effect adjusted (right) gene expression data of KS (circle) and matched non-tumor tissues (triangle) among cohorts. (C) An example Xena Browser Visual Spreadsheet examining the gene expression profiles of selected humans (ITGB1, FLT1, PDGFA and PDGFB) and KSHV genes (K12, LANA, ORF72) among the compiled KS dataset in the context of their phenotypic data (https://kaposi.xenahubs.net/). Gene expression data is colored red to blue for high to low expression respectively. UCSC Xena browser provides analytic tools to correlate the human and KSHV gene expression levels as well as to identify differentially expressed genes-based groups defined by the user (e.g. KS lesions vs. control skin). (D) Representative volcano plot of differentially expressed genes detected between KS and control samples using UCSC Xena browser. (E) Functional enrichment analysis of differentially expressed genes with Xena.
Fig. 2
Fig. 2
Transcriptomic, Immune and Functional Profiling of Kaposi Sarcoma Lesions. (A) Clustering results reveal distinct groups of KS lesions, with endemic lesions primarily in Cluster C1, while epidemic lesions are distributed across the three clusters. (B) Immune profiling using the ABIS algorithm demonstrates a higher immune cell infiltrate in KS lesions compared to controls. (C) Transcriptomic expression levels of immune checkpoint inhibitors (ICIs) indicate that Clusters C1 and C3 exhibit the highest expression levels. (D) Pathway activity analysis using Gene Ontology reveals reduced epithelial differentiation and increased immune activity in KS lesions, particularly in Clusters C1 and C3. Cluster C4 shows lower immune activity but a strong innate antiviral response. (E) Pathway activity analysis using Hallmarks reveals reduced metabolic processes in KS lesions compared to controls, along with increased proliferative activity, angiogenesis, and PI3K/Akt/mTOR signaling, particularly in Clusters C1 and C3.
Fig. 3
Fig. 3
Immune cell fractions across different clusters. (A) Box plots showing the distribution of immune cell fractions within each cluster assessed by ABIS algorithm, highlighting differences in immune composition. Statistical differences were assessed using the Wilcoxon rank test, with p-value thresholds set at *0.05, **0.01, **0.001, and ****0.0001. (B) Composition of the microenvironment by cluster as defined by the MCP-counter scores. Adjusted P values were obtained from Benjamini–Hochberg correction of two-sided Kruskal–Wallis tests P values.
Fig. 4
Fig. 4
Volcano plots showing differentially expressed genes (DEGs) across clusters. (A) Comparison of DEGs between the control cluster and the lesion clusters. (B) Comparison of DEGs between different lesion clusters. Each quadrant of the plots indicates the top 10 significantly upregulated or downregulated genes. The volcano plots are interpreted as follows: for a comparison such as C2 vs. C1, genes on the right are upregulated in C1, while those on the left are upregulated in C2 or downregulated in C1.
Fig. 5
Fig. 5
KSHV Transcriptomic Analysis Across Kaposi Sarcoma Lesion Clusters. (A) Heatmap visualization of the expression levels of 85 KSHV genes across control and lesion clusters. Gene expression data is colored red to blue for high to low expression respectively. Gene names along the dendrogram are shown in the amplified section at the left of the heatmap. The bar plot at the bottom displays LANA levels based on mapped reads. The error bar plot on the right illustrates the total KSHV mapped reads in each cluster, highlighting significant differences in cluster C1 compared to clusters C3 and C4 (p<0.01). (B) Box plots displaying the expression of key KSHV genes that are differentially expressed between clusters. These 14 genes were selected based on their known roles in viral latency, lytic reactivation, and immune modulation, as well as their differential expression across lesion clusters. *p <0.05; **p<0.01; ***p<0.001; ****p<0.0001.

Update of

References

    1. Cesarman, E. et al. Kaposi sarcoma. Nat. Rev. Dis. Primers5(1), 9 (2019). - PMC - PubMed
    1. Dittmer, D. P. & Damania, B. Kaposi sarcoma–associated herpesvirus: Immunobiology, oncogenesis, and therapy. J. Clin. Investig.126(9), 3165–3175 (2016). - PMC - PubMed
    1. Mesri, E. A., Cesarman, E. & Boshoff, C. Kaposi’s sarcoma and its associated herpesvirus. Nat. Rev. Cancer10(10), 707–719 (2010). - PMC - PubMed
    1. Naipauer, J. & Mesri, E. A. The Kaposi’s sarcoma progenitor enigma: KSHV-induced MEndT-EndMT axis. Trends Mol. Med.29(3), 188–200. 10.1016/j.molmed.2022.12.003 (2023). - PMC - PubMed
    1. Lacunza, E. et al. Unveiling the role of KSHV-infected human mesenchymal stem cells in Kaposi’s sarcoma initiation. J. Med. Virol.96(5), e29684. 10.1002/jmv.29684 (2024). - PMC - PubMed

LinkOut - more resources