Exploration of the genetic diversity of Avena Fatua L. (wild oat) through genotyping-by-sequencing and SDS-PAGE
- PMID: 41073911
- PMCID: PMC12512928
- DOI: 10.1186/s12870-025-07315-x
Exploration of the genetic diversity of Avena Fatua L. (wild oat) through genotyping-by-sequencing and SDS-PAGE
Abstract
Background: The consumption of oats has rapidly increased due to their exceptional nutritional value. However, concerns over genetic erosion have emerged as oat breeding programs rely on a highly limited genetic pool. This study aimed to expand the genetic diversity pool of oats by collecting wild oat (Avena fatua L.) populations in South Korea and assessing their genetic diversity and seed storage protein patterns.
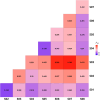
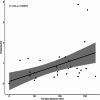
Results: A total of 237 A. fatua individuals were collected in 2022 from eight regions in the southwestern coastal areas of South Korea. Genetic diversity and seed storage protein patterns were analyzed using genotyping-by-sequencing (GBS) and sodium dodecyl sulfate polyacrylamide gel electrophoresis (SDS-PAGE). The GBS analysis identified 20,836 single-nucleotide polymorphisms (SNPs). An analysis of molecular variance (AMOVA) based on regional populations revealed that 40.9% of the genetic variation was attributed to differences among populations, while 59.1% was within populations, indicating high genetic differentiation within regional populations. Subsequent population structure analysis and discriminant analysis of principal components (DAPC) both stated the formation of two distinct genetic groups, with an AMOVA value of 70.9% between the groups, suggesting a high level of genetic variation. Pairwise FST analysis was conducted to compare the genetic differentiation between two populations, revealing that Jindo and Jangheung exhibited the highest level of genetic differentiation (FST = 0.795) among the geographic groups. Seed storage proteins were analyzed using SDS-PAGE, and the patterns were grouped using k-means clustering. A comparison between the groups based on protein patterns and those based on genetic variation revealed no significant correlation.
Conclusion: This study provides data on the genetic diversity of A. fatua, a wild relative of cultivated oats, aimed at expanding the genetic pool of oats for future breeding programs. These findings are expected to be a foundational resource for oat breeding and genetic improvement efforts.
Keywords: Avena Fatua; GBS; Genetic diversity; SDS-PAGE; Seed storage protein.
© 2025. The Author(s).
Conflict of interest statement
Declarations. Ethics approval and consent to participate: Not applicable. Consent for publication: Not applicable. Competing interests: The authors declare no competing interests.
Figures


References
-
- Thormann I, Engels JMM. Genetic diversity and erosion. A global perspective. Sustainable Dev Biodivers. 2015;7:263–94.
-
- United Nations. Biodiversity - our strongest natural defense against climate change. 2022. https://www.un.org/en/climatechange/science/climate-issues/biodiversity. Accessed 26 Aug 2022.
-
- Frankham R. Genetics and extinction. Biol Conserv. 2005;126(2):131–40.
-
- Tripp R, Heide W. The Erosion of crop genetic diversity: challenges, strategies and uncertainties. Nat Resour Perspect. 1996.
-
- Moyers BT, Morrell PL, McKay JK. Genetic costs of domestication and improvement. J Hered. 2018;109(2):103–16. - PubMed
MeSH terms
Substances
LinkOut - more resources
Full Text Sources
Miscellaneous

