. 2025 Oct 11;23(1):661.
doi: 10.1186/s12951-025-03720-4.

PDLIM4 drives gastric cancer malignant progression and cisplatin resistance by inhibiting HSP70 ubiquitination and degradation via competitive interaction with STUB1

Affiliations

PDLIM4 drives gastric cancer malignant progression and cisplatin resistance by inhibiting HSP70 ubiquitination and degradation via competitive interaction with STUB1

Chao Zhu et al. J Nanobiotechnology. .

Abstract

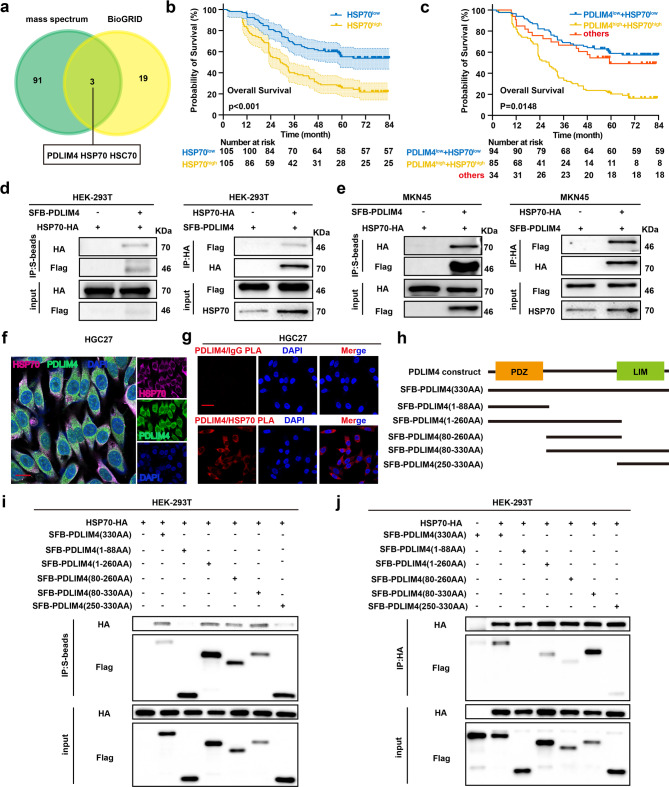
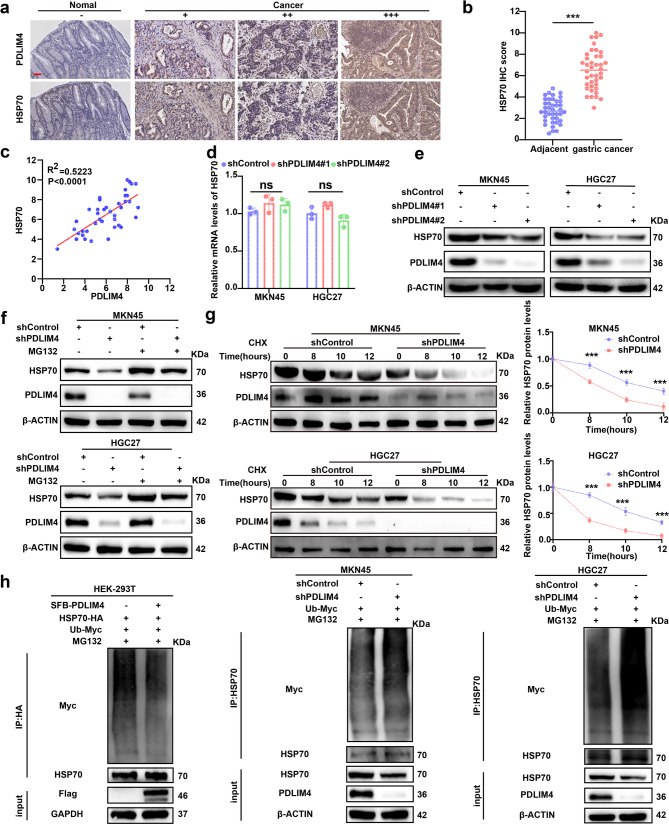
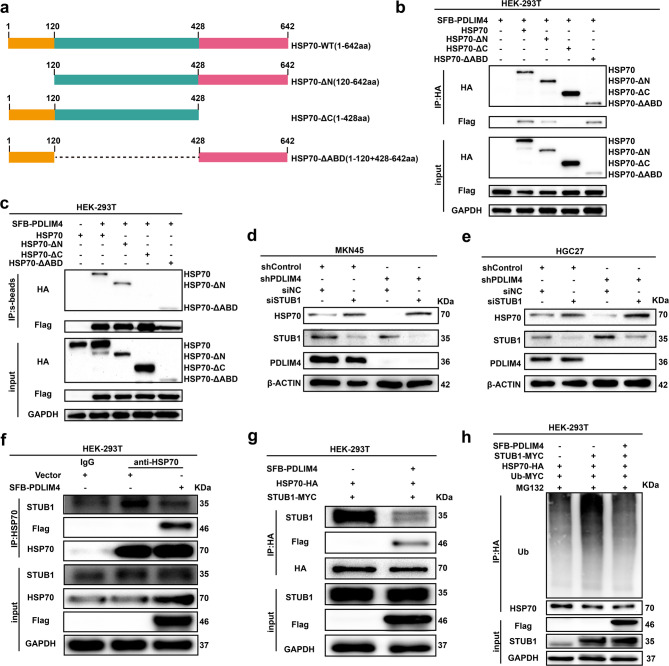
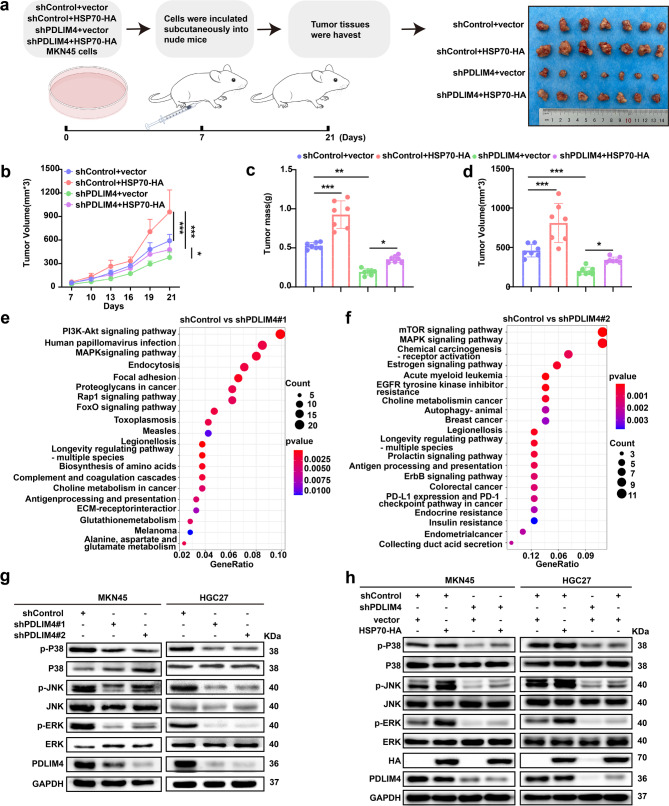
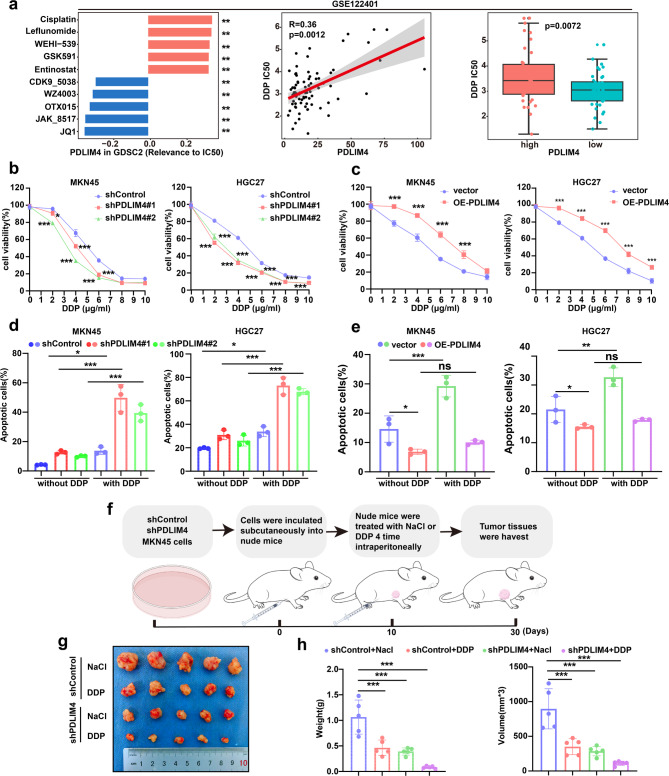
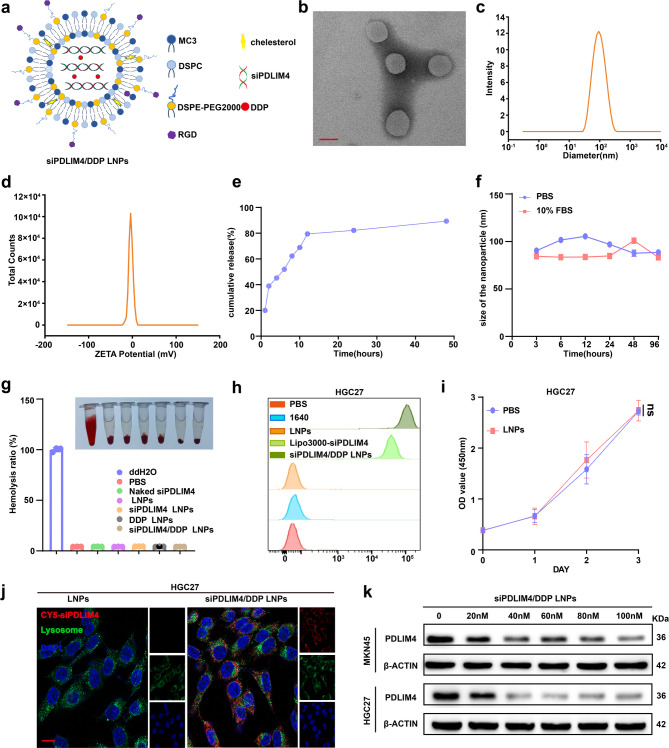
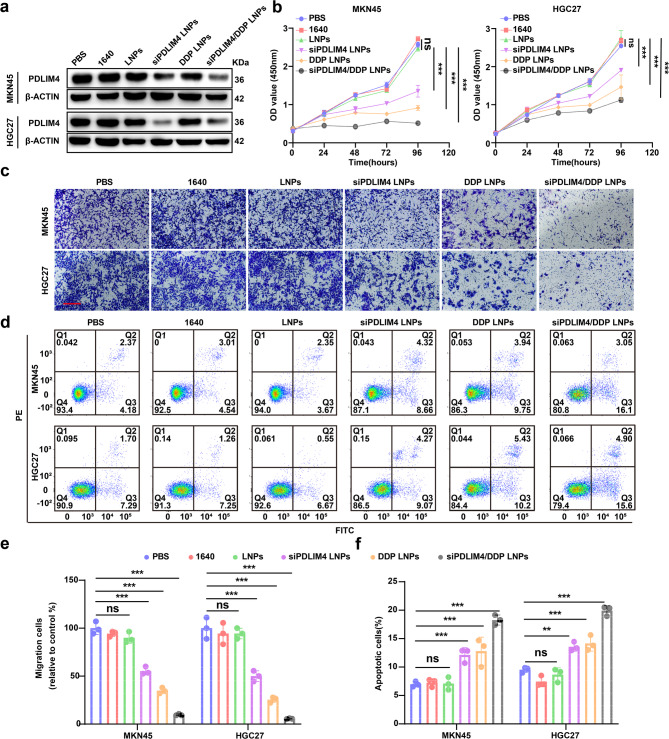
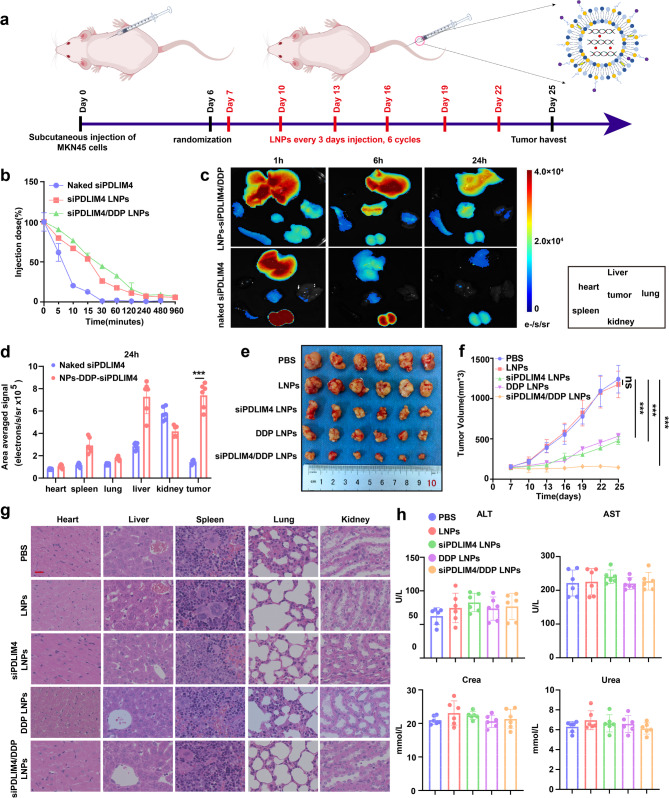
Gastric cancer (GC) frequently shows malignant progression and resistance to chemotherapy due to complex molecular regulatory processes, leading to a poor prognosis. Our study elucidates that PDZ and LIM domain protein 4 (PDLIM4) are highly expressed in GC, thereby promoting the malignant progression and cisplatin (DDP) resistance of GC. Mechanistically, PDLIM4, via its C-terminal and intermediate regions, impedes the ubiquitination and proteasomal degradation of Heat Shock Protein 70 (HSP70) by competing with the STIP1 homology and U-box containing protein 1 (STUB1), subsequently activating the MAPK signaling pathway. In addition, we synthesized lipid nanoparticles (LNPs), including siPDLIM4 LNPs, DDP LNPs, and siPDLIM4/DDP LNPs. Experiments further indicated that siPDLIM4 LNPs and DDP LNPs have an anti-tumor property, while siPDLIM4/DDP LNPs exhibit the most significant anti-tumor efficacy. In summary, our research identifies PDLIM4 as a facilitator of malignant progression and DDP resistance in GC cells, targeting PDLIM4 not only inhibits the malignant progression of GC, but also provides an effective strategy to enhance DDP sensitivity in GC treatment, emphasizing its potential as a therapeutic target.

Keywords: DDP; Gastric cancer; Lipid nanoparticles; PDLIM4; STUB1/HSP70; Ubiquitination.


Conflict of interest statement

Declarations. Ethics approval and consent to participate: The animal research received approval from the Ethics Committee of the First Affiliated Hospital of Nanchang University (Ethics Number: CDYFY-IACUC-202309QR019). The Ethics Committee of the First Affiliated Hospital of Nanchang University approved the study, and all participants provided informed consent (Approval Number: (2025) CDYFYYLK (04–030)). Consent for publication: All authors have read and approved the final manuscript. Competing interests: The authors declare no competing interests.

Figures

Fig. 1
Fig. 1
PDLIM4 is an independent prognostic factor for poor prognosis in GC patients.a-b A Lasso regression model was developed using the 551 genes from the GSE66229 dataset to determine the optimal parameter (λ). c Seven genes associated with prognosis were selected based on this optimal parameter (λ). d In the GSE66229 dataset, overall survival (OS) was stratified by high and low expression levels of PDLIM4. e Variations in PDLIM4 expression across different clinical stages of GC were observed in the GSE66229 dataset. f The GSE122401 dataset revealed differences in PDLIM4 expression between GC and normal tissues. g Quantitative analysis of PDLIM4 mRNA expression was performed on 40 pairs of GC tissues and their adjacent normal tissues. h Western blotting analysis was conducted to evaluate PDLIM4 protein levels in 16 pairs of GC tissues and adjacent normal tissues, with representative results displayed. i Immunohistochemistry (IHC) scoring was employed to assess PDLIM4 expression in 40 pairs of GC tissues and adjacent normal tissues. j Representative images of PDLIM4 IHC staining are provided for 4 pairs of GC tissues and adjacent normal tissues, scale bars: 50μm. k Patients were divided into two groups based on PDLIM4 expression and Kaplan Meier survival analysis was performed to examine the overall survival associated with PDLIM4 expression levels. Data were presented as means ± SD. *P<0.05; **P<0.01; ***P<0.001.
Fig. 2
Fig. 2
PDLIM4 promotes malignant progression of GC cells in vitro and in vivo.a RT-qPCR analysis demonstrated the efficiency of PDLIM4 KD at the mRNA level in MKN45 and HGC27 cells. b Western blotting analysis corroborated the knockdown efficiency of PDLIM4 at the protein level in MKN45 and HGC27 cells. c-d Clonal formation assays were conducted in MKN45 and HGC27 cells with PDLIM4 KD. e Cell viability assays indicated the effects of PDLIM4 depletion on MKN45 and HGC27 cells. f-g Apoptotic responses in MKN45 and HGC27 cells following PDLIM4 depletion were assessed. h The expression levels of apoptosis-related protein and cell cycle proteins were evaluated in MKN45 and HGC27 cells with PDLIM4 KD. i Representative images of tumors harvested from mice injected with shPDLIM4 or shControl MKN45 cells are presented. j Tumor growth was monitored in vivo, measuring tumor volume over time. k The weight and volume of harvested tumors were recorded (n = 6). l The mRNA expression levels of PDLIM4 in each tumor group were quantified. Data were presented as means±SD. *P<0.05; **P<0.01; ***P<0.001.
Fig. 3
Fig. 3
PDLIM4 interacts with HSP70.a Integration of mass spectrometry data with the BioGRID database. b Kaplan-Meier survival analysis of OS was performed using HSP70 expression levels. Patients were split into two groups, HSP70High and HSP70low, based on the median IHC staining score (6 for HSP70). c Kaplan-Meier survival curves for OS in patients categorized by the IHC staining scores (5.33 for PDLIM4 and 6 for HSP70) are shown. Patients were grouped into three categories based on the expression levels of PDLIM4 and HSP70: PDLIM4High + HSP70High, PDLIM4Low + HSP70Low and others. d Examination of the interaction between exogenously expressed SFB-tagged PDLIM4 and HSP70 in HEK-293T cells using a co-immunoprecipitation assay. e Investigation of the interaction between exogenously expressed SFB-tagged PDLIM4 and HSP70 in MKN45 cells via a co-immunoprecipitation assay. f Immunofluorescence analysis of PDLIM4 and HSP70 expression in HGC27 cells, Scale bar: 20 μm. g The interaction between PDLIM4 and HSP70 in HGC27 cells was detected by PLA, Scale bar: 20μm. h Based on previous studies, PDLIM4 is categorized into distinct structural domains. i-j Analysis of the interaction between various exogenous SFB-tagged PDLIM4 constructs (330AA, 1-88AA, 1-260AA, 80-260AA, 80-330AA, 250-330AA) and HSP70 in HEK-293T cells through a co-immunoprecipitation (CO-IP) assay.
Fig. 4
Fig. 4
PDLIM4 positive regulates HSP70’s Protein level through ubiquitination. a Representative immunohistochemistry staining images of PDLIM4 and HSP70 across various grades of GC tissues and adjacent normal tissues, scale bars: 50μm. b IHC scores for HSP70 in 40 pairs of samples of GC tissues and adjacent normal tissues. c Analysis of the protein expression levels of PDLIM4 and HSP70 in GC tissues using Spearman 's correlation. d Evaluation of the mRNA expression level of HSP70 in GC cells following PDLIM4 KD. e Assessment of the protein expression level of HSP70 in GC cells with PDLIM4 KD. f Western blotting analysis of HSP70 in MKN45 and HGC27 cells with PDLIM4 KD after treatment with MG132 (20 μM). g Determination of the HSP70 degradation half-life in MKN45 and HGC27 cells with PDLIM4 KD in the presence of cycloheximide (CHX, 200 μg/mL). h Analysis of HSP70 ubiquitination levels in cells with PDLIM4 knockdown or overexpression. Data were presented as means±SD. ***P<0.001; ns, no statistical difference.
Fig. 5
Fig. 5
PDLIM4 blocks STUB1 interaction with HSP70 and STUB1-mediated ubiquitination and proteasomal degradation of HSP70.a Previous studies have delineated that HSP70 comprises several distinct structural domains. b-c The interaction among exogenous HSP70, HSP70-ΔN, HSP70-ΔC, HSP70-ΔABD and SFB-PDLIM4 in HEK-293T cells was examined using a co-immunoprecipitation (CO-IP) assay. d-e. Western blotting analyses were conducted to assess the expression levels of PDLIM4, HSP70, and STUB1 in MKN45 and HGC27 cells, which were co-transfected with PDLIM4 shRNA and STUB1 siRNA. f The presence of exogenous SFB-PDLIM4 disrupted the interaction between endogenous HSP70 and STUB1 in HEK-293T cells. g Exogenous SFB-PDLIM4 disrupted the interaction between exogenous HSP70 and STUB1 in HEK-293T cells. h The levels of HSP70 ubiquitination were evaluated in HEK-293T cells with overexpressing STUB1 or co-expressing both STUB1 and PDLIM4.
Fig. 6
Fig. 6
DLIM4 promotes GC cells malignant progression by regulating the HSP70-mediated MAPK signaling pathway.a Diagrammatic representation of the in vivo and image of tumors. b Growth of tumor volume in vivo. c-d Weight and volume of the harvested tumors (n = 7). e-f KEGG enrichment analysis of differentially expressed genes between shControl and shPDLIM4#1/2 MKN45 cells. g Western blotting was used to analyze the total and phosphorylation protein levels of P38, JNK, and ERK on MKN45 and HGC27 cells with PDLIM4 KD. h Western blotting was used to analyze the total and phosphorylation protein levels of P38, JNK, and ERK on PDLIM4 KD MKN45 and HGC27 cells with HSP70 overexpression. Data were presented as means±SD. *P<0.05; **P<0.01; ***P<0.001.
Fig. 7
Fig. 7
PDLIM4 enhances GC cell resistance to DDP in a manner of HSP70.a Analysis of the correlation between PDLIM4 expression levels and DDP IC50 values in the GSE122401 dataset. b Assessment of cell viability in PDLIM4 KD cells following a 24-hour treatment with DDP. c Assessment of cell viability in PDLIM4 overexpression cells following a 24-hour treatment with DDP. d Examination of apoptotic activity in PDLIM4 KD MKN45 and HGC27 cells after 24 hours of DDP exposure. e Examination of apoptotic activity in PDLIM4 overexpression MKN45 and HGC27 cells after 24 hours of DDP exposure. f Diagrammatic representation of the in vivo. g Image of tumors. h Weight and volume of the harvested tumors (n = 5). Data were presented as means±SD. *P<0.05; **P<0.01; ***P<0.001; ns, no statistical difference.
Fig. 8
Fig. 8
The Biological Feature of siPDLIM4/DDP LNPs.a A schematic representation of siPDLIM4/DDP LNPs is provided. b Transmission electron microscopy images of siPDLIM4/DDP LNPs are shown, scale bars: 100 nm. c-d Dynamic light scattering was employed to determine the particle sizes (c) and zeta potentials (d) of the siPDLIM4/DDP LNPs. e Cumulative release of DDP in siPDLIM4/DDP LNPs at different time. f The stability of siPDLIM4/DDP LNPs was assessed over a period of 96 hours in PBS or PBS containing 10% serum at 37 ℃. g Hemolysis of erythrocytes was observed following a 2-hour incubation with PBS, deionized water, or various LNPs. h The proportion of CY5-positive cells in HGC27 cells was quantified using flow cytometry. i The survival rate of HGC27 cells was evaluated after exposure to PBS or LNPs. j Confocal laser scanning microscopy images of HGC27 cells were acquired following 4-hour incubation with either LNPs or siPDLIM4/DDP LNPs. Endosomes were stained green with Lysotracker, nuclei were stained blue with Hoechst 33342, and siPDLIM4 was labeled with CY5, scale bars: 20μm. k The knockdown efficiency of PDLIM4 in MKN45 and HGC27 cells was detected by Western blotting after treatment with various concentrations of siPDLIM4/DDP LNPs. Data were presented as means±SD. ns, no statistical difference.
Fig. 9
Fig. 9
siPDLIM4/DDP LNPs inhibit the malignant progression of GC cells and increase the sensitivity to DDP treatment in vitro.a The protein expression levels of PDLIM4 were assessed in MKN45 and HGC27 cells using western blotting following treatment with PBS, 1640, LNPs, siPDLIM4 LNPs, DDP LNPs, or siPDLIM4/DDP LNPs. b The cell viability of MKN45 and HGC27 cells was evaluated after treatment with PBS, 1640, LNPs, siPDLIM4 LNPs, DDP LNPs, or siPDLIM4/DDP LNPs. c, e The migratory capacity of MKN45 and HGC27 cells, treated with PBS, 1640, LNPs, siPDLIM4 LNPs, DDP LNPs, or siPDLIM4/DDP LNPs, was determined using an in vitro Transwell migration assay, scale bars: 200μm. d, f Apoptosis in MKN45 and HGC27 cells was analyzed following treatment with PBS, 1640, LNPs, siPDLIM4 LNPs, DDP LNPs, or siPDLIM4/DDP LNPs. Data were presented as means±SD. **P<0.01; ***P<0.001; ns, no statistical difference.
Fig. 10
Fig. 10
In vivo evaluation of the therapeutic efficacy and toxicity of siPDLIM4/DDP LNPs.a A schematic diagram illustrates the timeline for tumor implantation and the administration of PBS, LNPs, siPDLIM4 LNPs, DDP LNPs, and siPDLIM4/DDP LNPs in mice bearing MKN45 tumors. The mice received LNPs injections at three-day intervals for a total of six cycles. b The pharmacokinetics of naked siPDLIM4, siPDLIM4 LNPs and siPDLIM4/DDP LNPs were evaluated in vivo. c Naked CY5-siPDLIM4 and CY5-siPDLIM4/DDP LNPs were administered intravenously and 1, 6, 24 hours post-injection, tumors and major organs were harvested for biodistribution analysis using small animal CT/live imaging all-in-one machine (Milabs B.V.). d Quantitative data revealed the distribution of naked siPDLIM4 and siPDLIM4/DDP LNPs across various organs, including tumors, in MKN45 tumor bearing mice after 24 hours post-injection. e Representative images of tumors (n = 6) are provided. f The progression of tumor volume in vivo is depicted. g Hematoxylin and eosin (H&E) stained images of key organs are presented following treatment with PBS, LNPs, siPDLIM4 LNPs, DDP LNPs, and siPDLIM4/DDP LNPs, scale bar: 20 μm. h Serum levels of ALT, AST, creatinine, and urea were measured following treatment with PBS, LNPs, siPDLIM4 LNPs, DDP LNPs, and siPDLIM4/DDP LNPs. Data were presented as means±SD. ***P<0.001; ns, no statistical difference.

References

    1. Bray F, Laversanne M, Sung H, Ferlay J, Siegel RL, Soerjomataram I, et al. Global cancer statistics 2022: GLOBOCAN estimates of incidence and mortality worldwide for 36 cancers in 185 countries. Ca-a Cancer Journal for Clinicians. 2024;74:229–63. - PubMed
    1. Sundar R, Nakayama I, Markar SR, Shitara K, van Laarhoven HWM, Janjigian YY, et al. Gastric cancer. Lancet (London, England). 2025. 10.1016/S0140-6736(25)00052-2. - PubMed
    1. Fu D, Wang C, Yu L, Yu R. Induction of ferroptosis by ATF3 elevation alleviates cisplatin resistance in gastric cancer by restraining Nrf2/Keap1/xCT signaling. Cell Mol Biol Lett. 2021. 10.1186/s11658-021-00271-y. - PMC - PubMed
    1. Cho HJ, Baek KE, Park S-M, Kim I-K, Nam I-K, Choi Y-L, et al. RhoGDI2 confers gastric cancer cells resistance against cisplatin-induced apoptosis by upregulation of Bcl-2 expression. Cancer Lett. 2011;311:48–56. - PubMed
    1. He X, Zhong L, Wang N, Zhao B, Wang Y, Wu X, et al. Gastric cancer actively remodels mechanical microenvironment to promote chemotherapy resistance via MSCs-mediated mitochondrial transfer. Adv Sci. 2024. 10.1002/advs.202404994. - PMC - PubMed

MeSH terms