. 2025 Oct 12:vkaf249.
doi: 10.1093/jimmun/vkaf249. Online ahead of print.

Interferon-sensitized hematopoietic progenitors dynamically alter organismal immunity

Affiliations

Interferon-sensitized hematopoietic progenitors dynamically alter organismal immunity

Maria Guillamot et al. J Immunol. .

Abstract

Inflammation has enduring impacts on organismal immunity. However, the precise mechanisms by which tissue-restricted inflammation conditions systemic responses are poorly understood. Here, we leveraged a highly compartmentalized model of skin inflammation and identified a surprising type I interferon (IFN)-mediated activation of hematopoietic stem/progenitor cells (HSPCs) that results in profound changes to systemic host responses. Post-inflamed mice were protected from atherosclerosis and had worse outcomes following influenza virus infection. This IFN-mediated HSPC modulation was dependent on IFNAR signaling and could be recapitulated with the administration of recombinant IFN-α. Importantly, the transfer of post-inflamed HSPCs was sufficient to transmit the immune suppression phenotype. IFN modulation of HSPCs was rooted both in long-term changes in chromatin accessibility and the emergence of an IFN-responsive functional state from multiple progenitor populations. Collectively, our data reveal the profound and enduring effect of transient inflammation and more specifically type I IFN signaling and set the stage for a more nuanced understanding of HSPC functional modulation by peripheral immune signals.

Keywords: hematopoietic stem and progenitor cells; innate immune memory; interferon α; skin inflammation.


Conflict of interest statement

SN is on the SAB of Seed Inc. and receives funding from Takeda Pharmaceuticals. This activity is not relevant to the content of this manuscript. The remaining authors declare no competing interests.

Figures
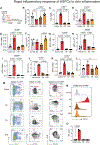
Fig. 1.
Fig. 1.. Bone marrow responses rapidly activate and resolve before the peak of skin inflammation
(A) Schematic of experiment analyzing bone marrow (BM) progenitor populations during and after Imiquimod (IMQ) treatment. Analyses were performed 0, 2, 6 and 30 of this protocol (n=3–4 mice/group). (B-L) Absolute numbers and frequencies of bone marrow cells, including (B) all cells, (C-D) Lin-Sca1+c-Kit+ (LSKs), (E-F) Hematopoietic Stem Cell (HSCs), (G-L) Multipotent progenitors (MPP). (M) Representative flow cytometry plots and gating strategy. (N) Sca-1 surface expression in LSKs, represented by mean-fluorescent intensity (MFI) and (O) its quantification. P-values were determined via ordinary one-way ANOVA with Tukey’s multiple comparisons test. Plots represent mean ± SEM. Each dot is an individual animal.
Fig. 2.
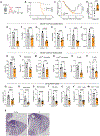
Fig. 2.. Transient skin inflammation modifies susceptibility to influenza infection
(A) Flu infection post-skin inflammation- experimental design (n=13 mice per group). WT mice were treated with IMQ of vehicle for 7 days and rested until full recovery (day 30), after which they were inoculated with influenza and followed for 2 weeks. (B) Survival and (C) weight of mice following flu inoculation at day 0. (D) Expression of the influenza gene Ns1 in lungs, measured by qPCR. (E-J) HSPC counts and frequencies, (K-P) mature leukocyte cell counts in BM, (Q-W) lung leukocyte counts at day 7 post-inoculation, measured using flow cytometry and (X) representative lung images (scale bar=1.5mm; n=3–7 mice/group). P-values were determined via unpaired two-tailed Student’s t-test, except for (B) that was determined with Gehan-Breslow-Wilcoxon test. Plots represent mean ± SEM and of two-three independent experiments. Each dot is an individual animal.
Fig. 3.
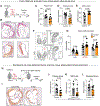
Fig. 3.. Transient skin inflammation modifies susceptibility to atherosclerosis
(A) Atherosclerosis post-skin inflammation- experimental design (n=9–10 mice per group). Ldlr−/− mice were treated with IMQ or vehicle for 7 days and rested until full recovery (day 30), after which they were fed a Western Diet (WD) for 12 weeks. (B) Representative images of aortic roots stained for CD68. Atherosclerosis plaques are demarcated yellow. Scale bar=0.25mm. (C-E) Morphometric quantification of (C) plaque area, (D) complexity (scored using the Stary scale) and (E) macrophage content. (F-G) Flow cytometry analysis of macrophages from aortic arches, examined for inflammatory (Ly6C) and pro-resolving (CD163 and CD206) markers. Gating strategy presented in (F) and quantification in (G). (H) Atherosclerosis progression in recipients of post-inflamed bone marrow- experimental design. WT mice were treated with IMQ or vehicle for 7 days and rested subsequently until day 30. Bone marrow was then harvested and transplanted to lethally irradiated naive Ldlr−/− mice. Four-weeks later, bone marrow recipients started WD feeding for 14 weeks and plaques were assessed thereafter in aortic roots (n=12 mice per group). (I) Representative images (scale bar=0.25mm), (J) plaque and (K) macrophage area, and (L) disease complexity scored using the Stary scale. P-values were determined via unpaired two-tailed Student’s t-test. Plots represent mean ± SEM. Each dot is an individual animal.
Fig. 4.
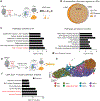
Fig. 4.. Skin inflammation increases chromatin accessibility in type I IFN genes and promotes a Sca-1high HSPC state.
(A) Experimental design. Control and PI (at day 30 post-IMQ treatment and recovery) LSKs were sorted and ATAC-seq performed. (B) ATAC-seq results showing the proportion of accessible chromatin regions that are unique or overlap in the two groups. (C) Pathway enrichment analysis of the unique accessible regions in PI (left) and control (right) LSKs. (D) Experimental design. Control and PI mice (at day 30 post-IMQ treatment and recovery) were fed a WD for 30 days. LSKs were sorted and single-cell RNA-seq performed. (E) Cluster analysis represented in a UMAP. Red arrows indicate Ly6a/e Sca-1high LSKs. (F) Pathway enrichment analysis of Ly6a/e Sca-1high cluster. n=3/group.
Fig. 5.
Fig. 5.. Type I IFN signaling drives early HSCs activation following skin inflammation
(A) An available scRNAseq dataset of normal mouse bone marrow (Tikhonova et al.) was analyzed for HSPC expression of cytokine receptors and TLR7. (B-D) IFNα levels in the (B) skin, (C) plasma and (D) bone marrow at different timepoints PI (n=/4–11group). (E) Expression of IFN-stimulated genes in bone marrow post-IMQ treatment (n=/3–8group). (F-I) Ifnar−/− and Ifnar+/+ bone marrow was transplanted in WT mice. After recovery, recipients were treated with IMQ for 2 days and examined for LSK abundance and Sca-1 expression (n=3/group). (F) Experimental design. (G) Representative flow cytometry plots and (H) their quantification. (I) Sca-1 surface levels in LSKs. P-values were determined via (B-E) one-way ANOVA with Tukey’s multiple comparisons test and (H) unpaired two-tailed Student’s t-test.
Fig. 6.
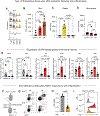
Fig. 6.. Transient IFNα treatment recapitulates HSPC phenotype post-skin inflammation
(A-D) WT mice were examined for LSK abundance and Sca-1 expression at day 0, 2 and 7 post-injection with IFNα (n=4–5). (A) Experimental design. (B) Representative flow cytometry plots and (C) their quantification. (D) Sca-1 surface levels in LSKs. (E-G) Ldlr−/− mice were treated with IFNα for 2 days and rested for 1 week before placing them on WD for 12 weeks (n=8). (E) Experimental design. (F) Representative images of aortic roots stained for CD68. Atherosclerosis plaques are demarcated yellow. Scale bar=0.25mm. (G) Plaque complexity quantified using the Stary scale. (H-K) WT mice were treated with IFNα for 2 days and rested for 1 week before inoculation with influenza. (H) Experimental design. (I) Representative lung images at day 7 post-inoculation. (J) Mouse weights and (K) survival following flu inoculation (n=18). P-values were determined via (C) one-way ANOVA with Tukey’s multiple comparisons test, (G, J) unpaired two-tailed Student’s t-test, and (K) Gehan-Breslow-Wilcoxon test. Plots represent mean ± SEM and are representative of two independent experiments. Each dot is an individual animal.

Update of

References

    1. Chovatiya R & Medzhitov R Stress, inflammation, and defense of homeostasis. Mol Cell 54, 281–288, doi: 10.1016/j.molcel.2014.03.030 (2014). - DOI - PMC - PubMed
    1. Wilson A & Trumpp A Bone-marrow haematopoietic-stem-cell niches. Nat Rev Immunol 6, 93–106, doi: 10.1038/nri1779 (2006). - DOI - PubMed
    1. Comazzetto S, Shen B & Morrison SJ Niches that regulate stem cells and hematopoiesis in adult bone marrow. Dev Cell 56, 1848–1860, doi: 10.1016/j.devcel.2021.05.018 (2021). - DOI - PMC - PubMed
    1. Pietras EM Inflammation: a key regulator of hematopoietic stem cell fate in health and disease. Blood 130, 1693–1698, doi: 10.1182/blood-2017-06-780882 (2017). - DOI - PMC - PubMed
    1. Kaufmann E et al. BCG Educates Hematopoietic Stem Cells to Generate Protective Innate Immunity against Tuberculosis. Cell 172, 176–190 e119, doi: 10.1016/j.cell.2017.12.031 (2018). - DOI - PubMed

LinkOut - more resources